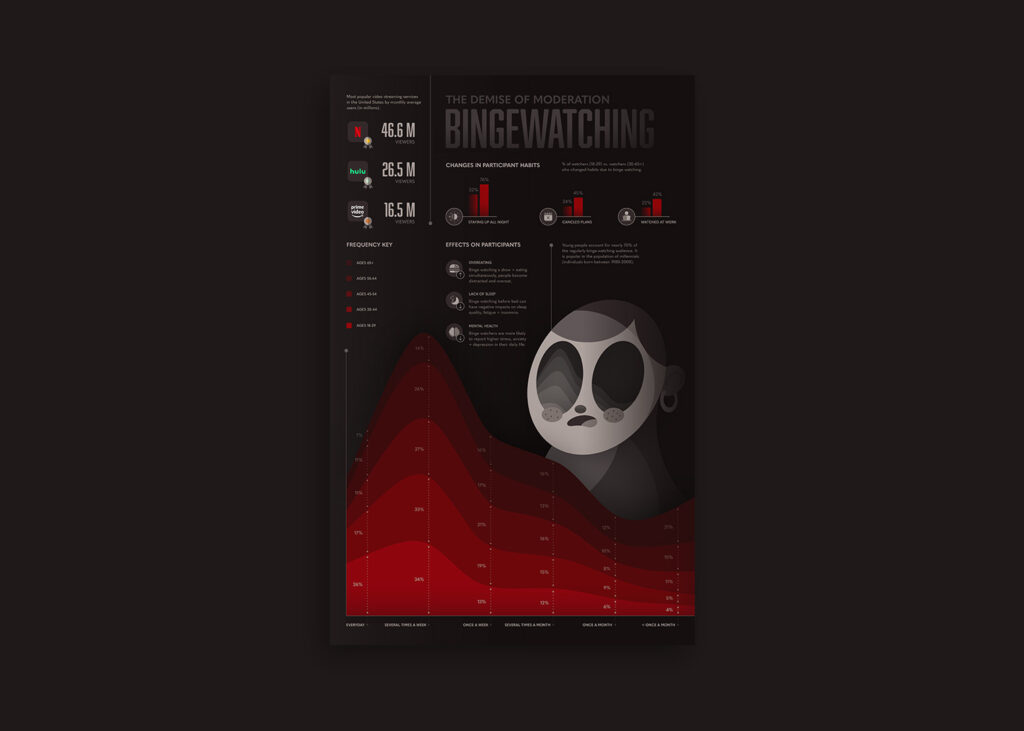
Visualize and design a set of complex information and data.
02.
Analyze social, environmental, and audience factors in relation to design concepts.
03.
Employ visual clarity, semantics, and aesthetics through the integration of content and form.
The Goal
Design an information graphic that utilizes various design systems ( composition, typography, grid, color, form, photography, illustration, iconography, etc. ) in relation to a personally determined topic surrounding the theme of culture.
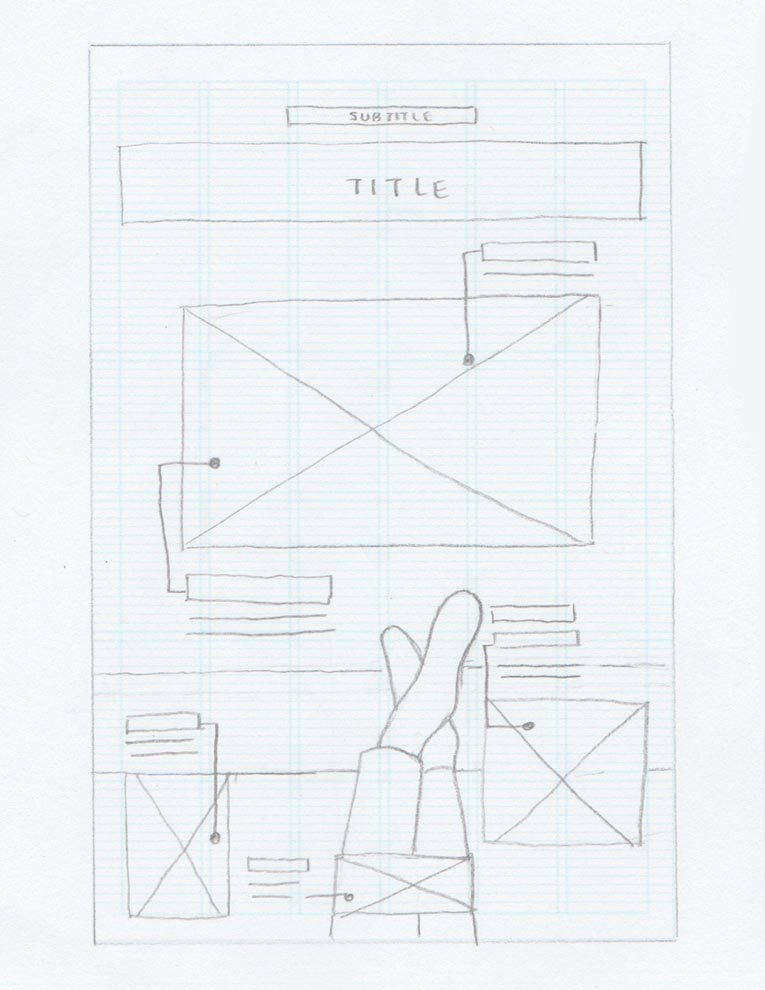
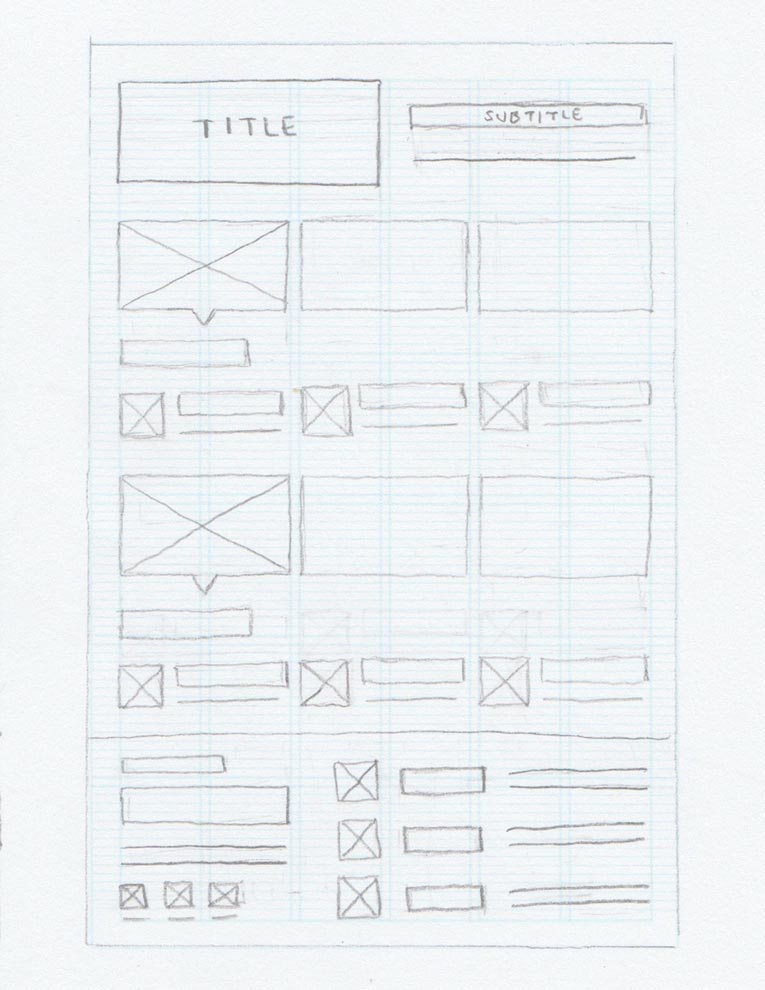
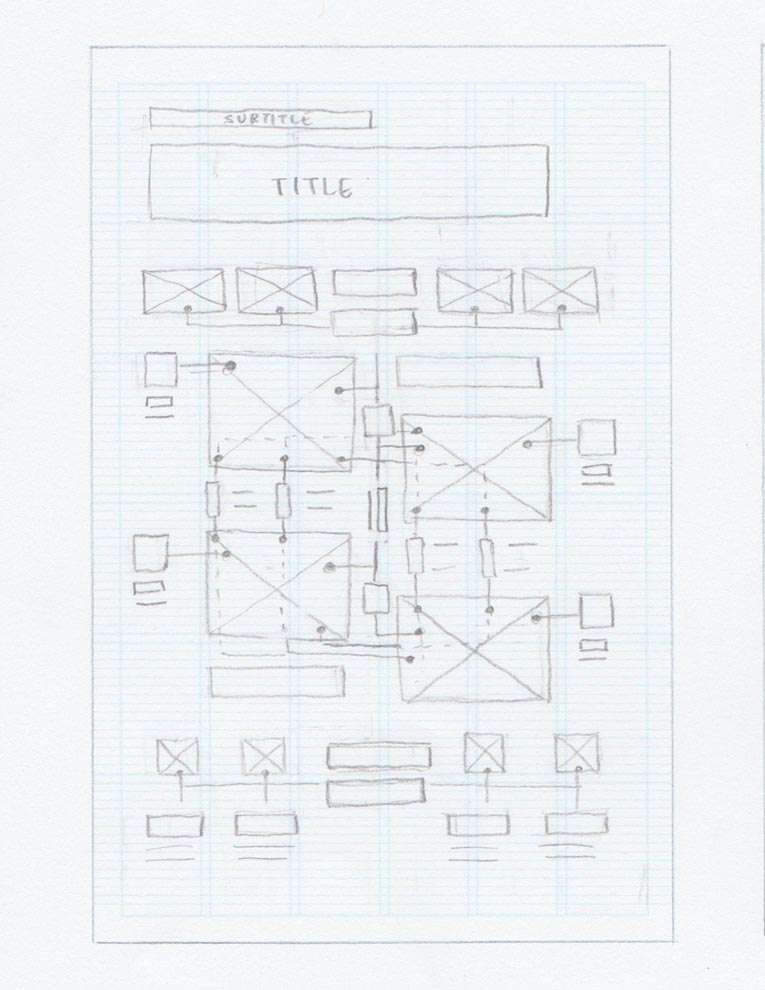
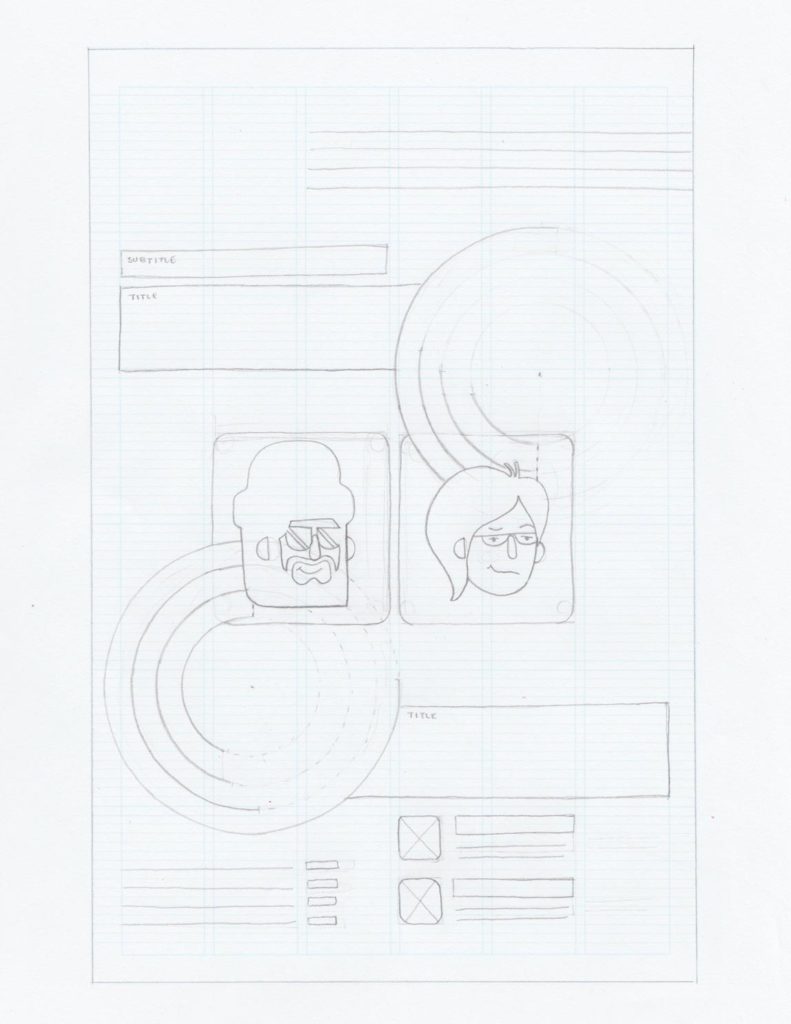
Sketches
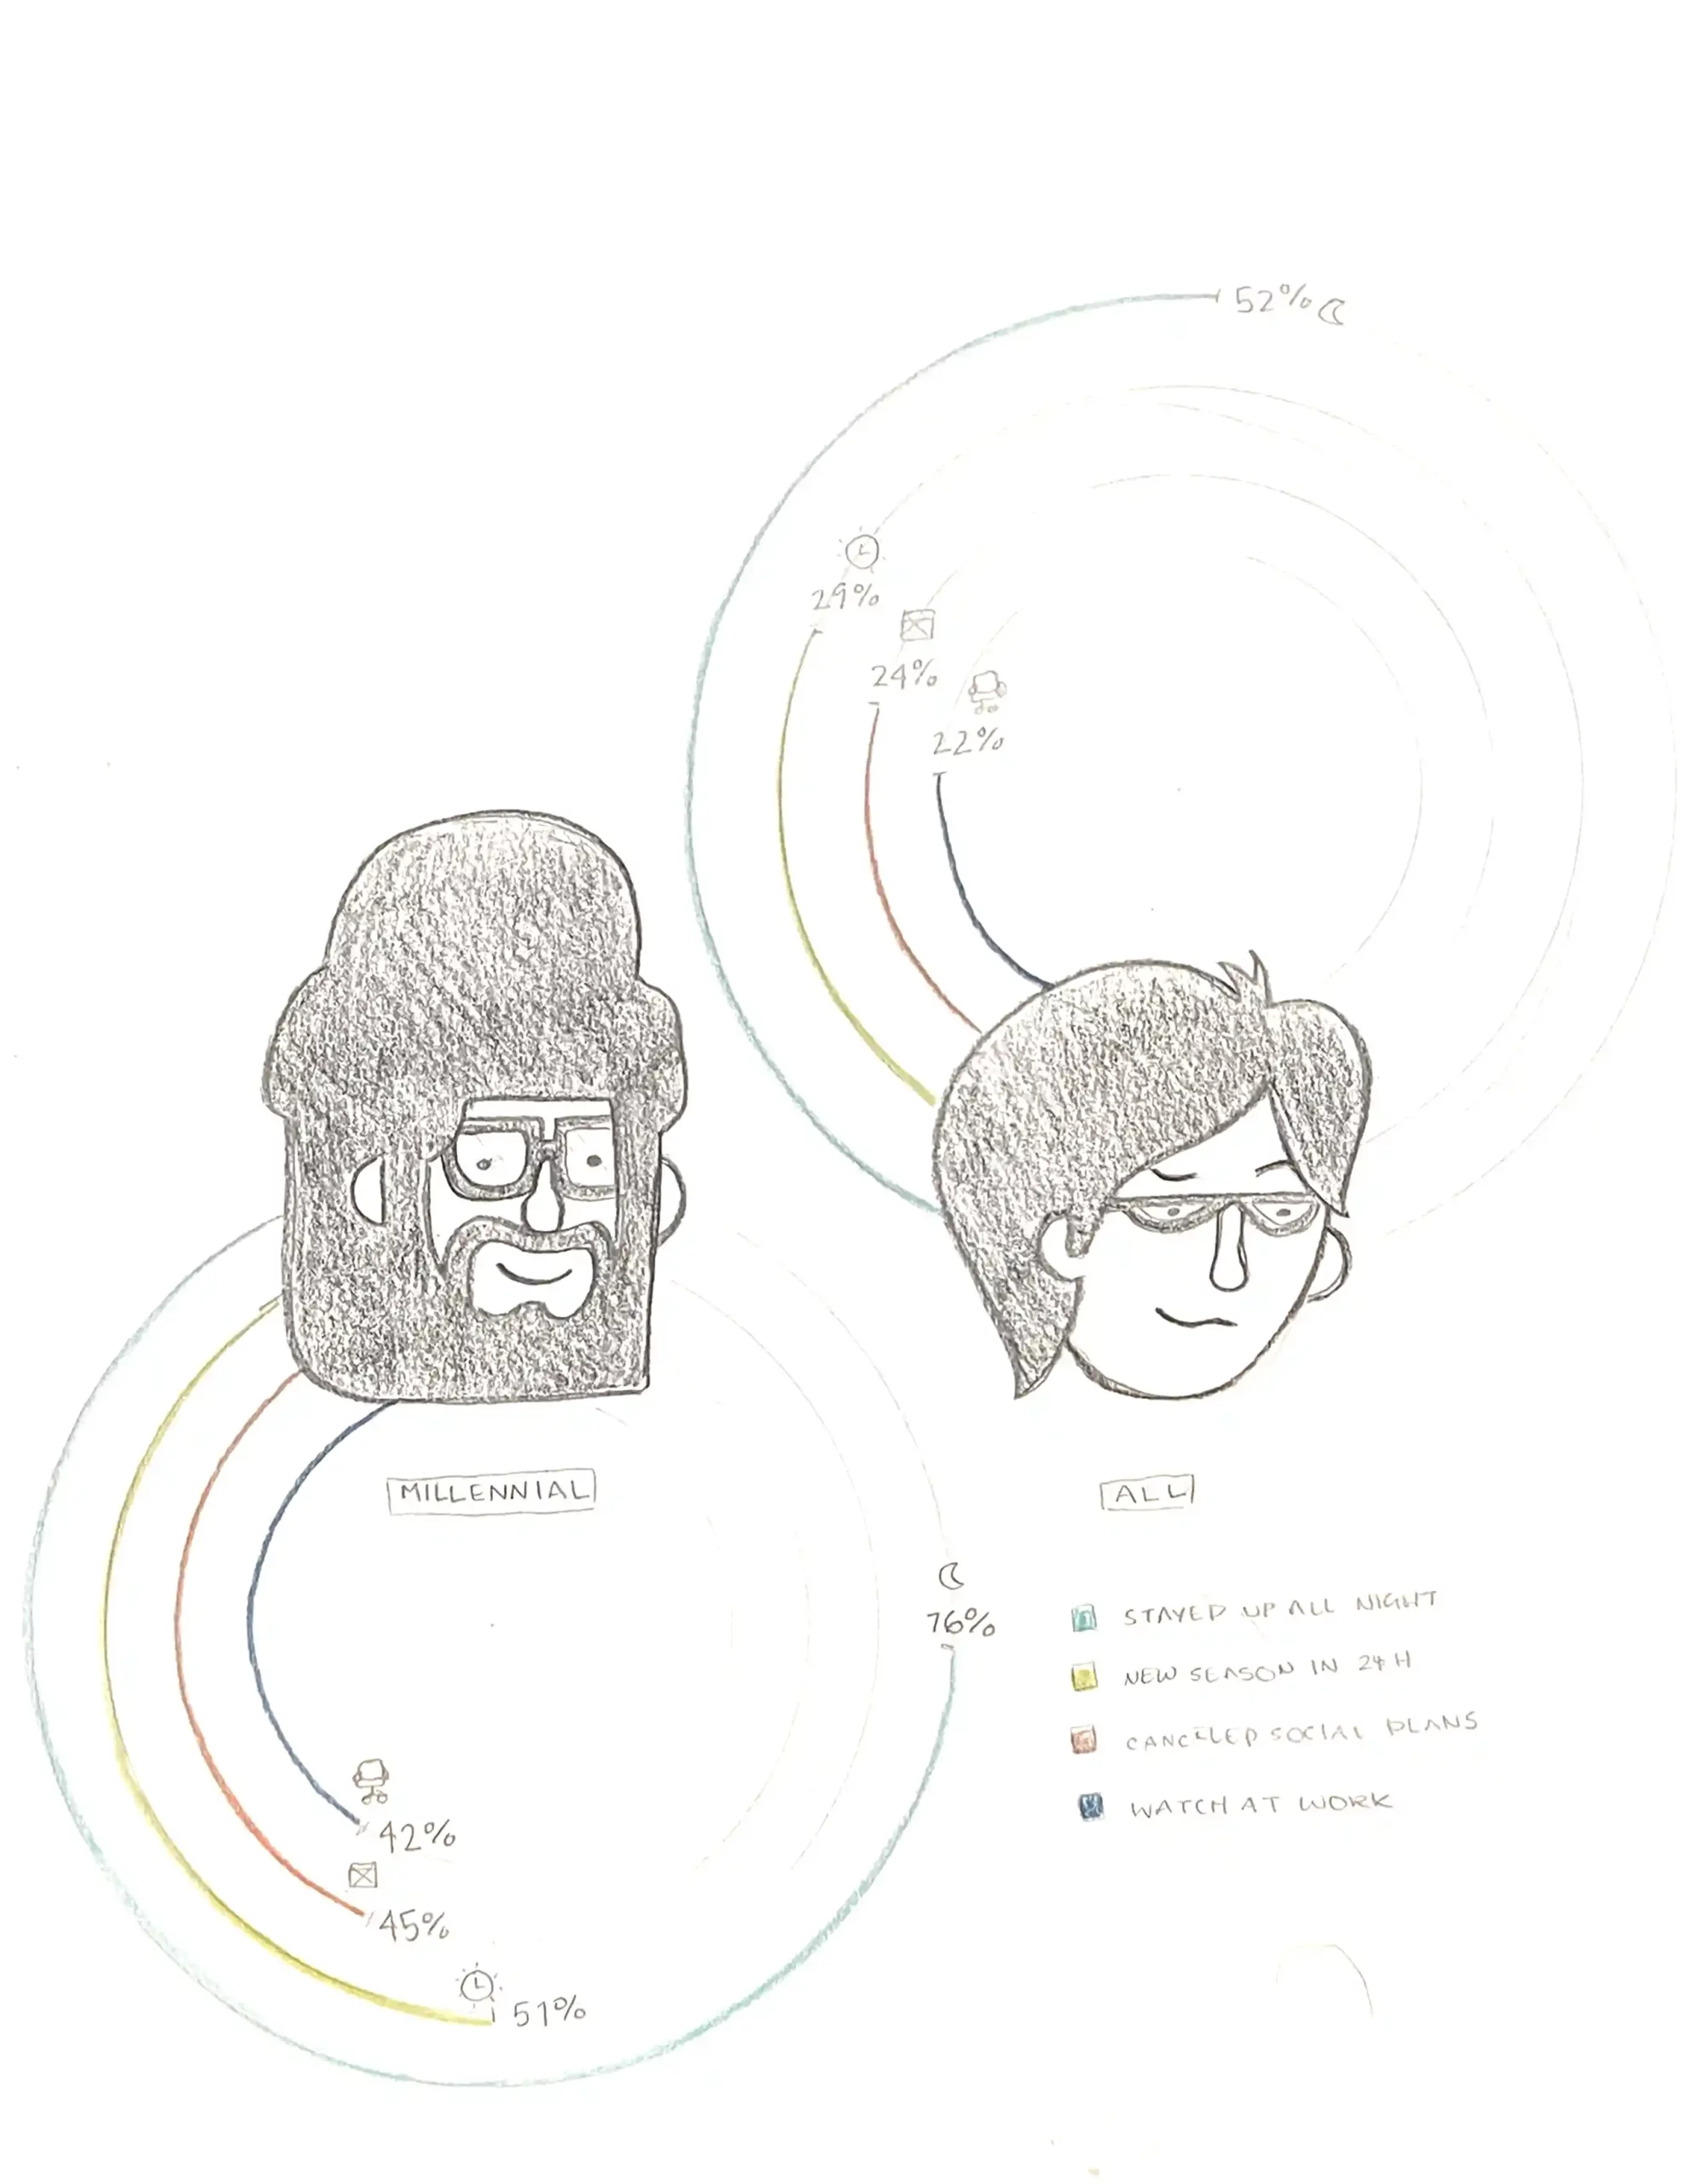
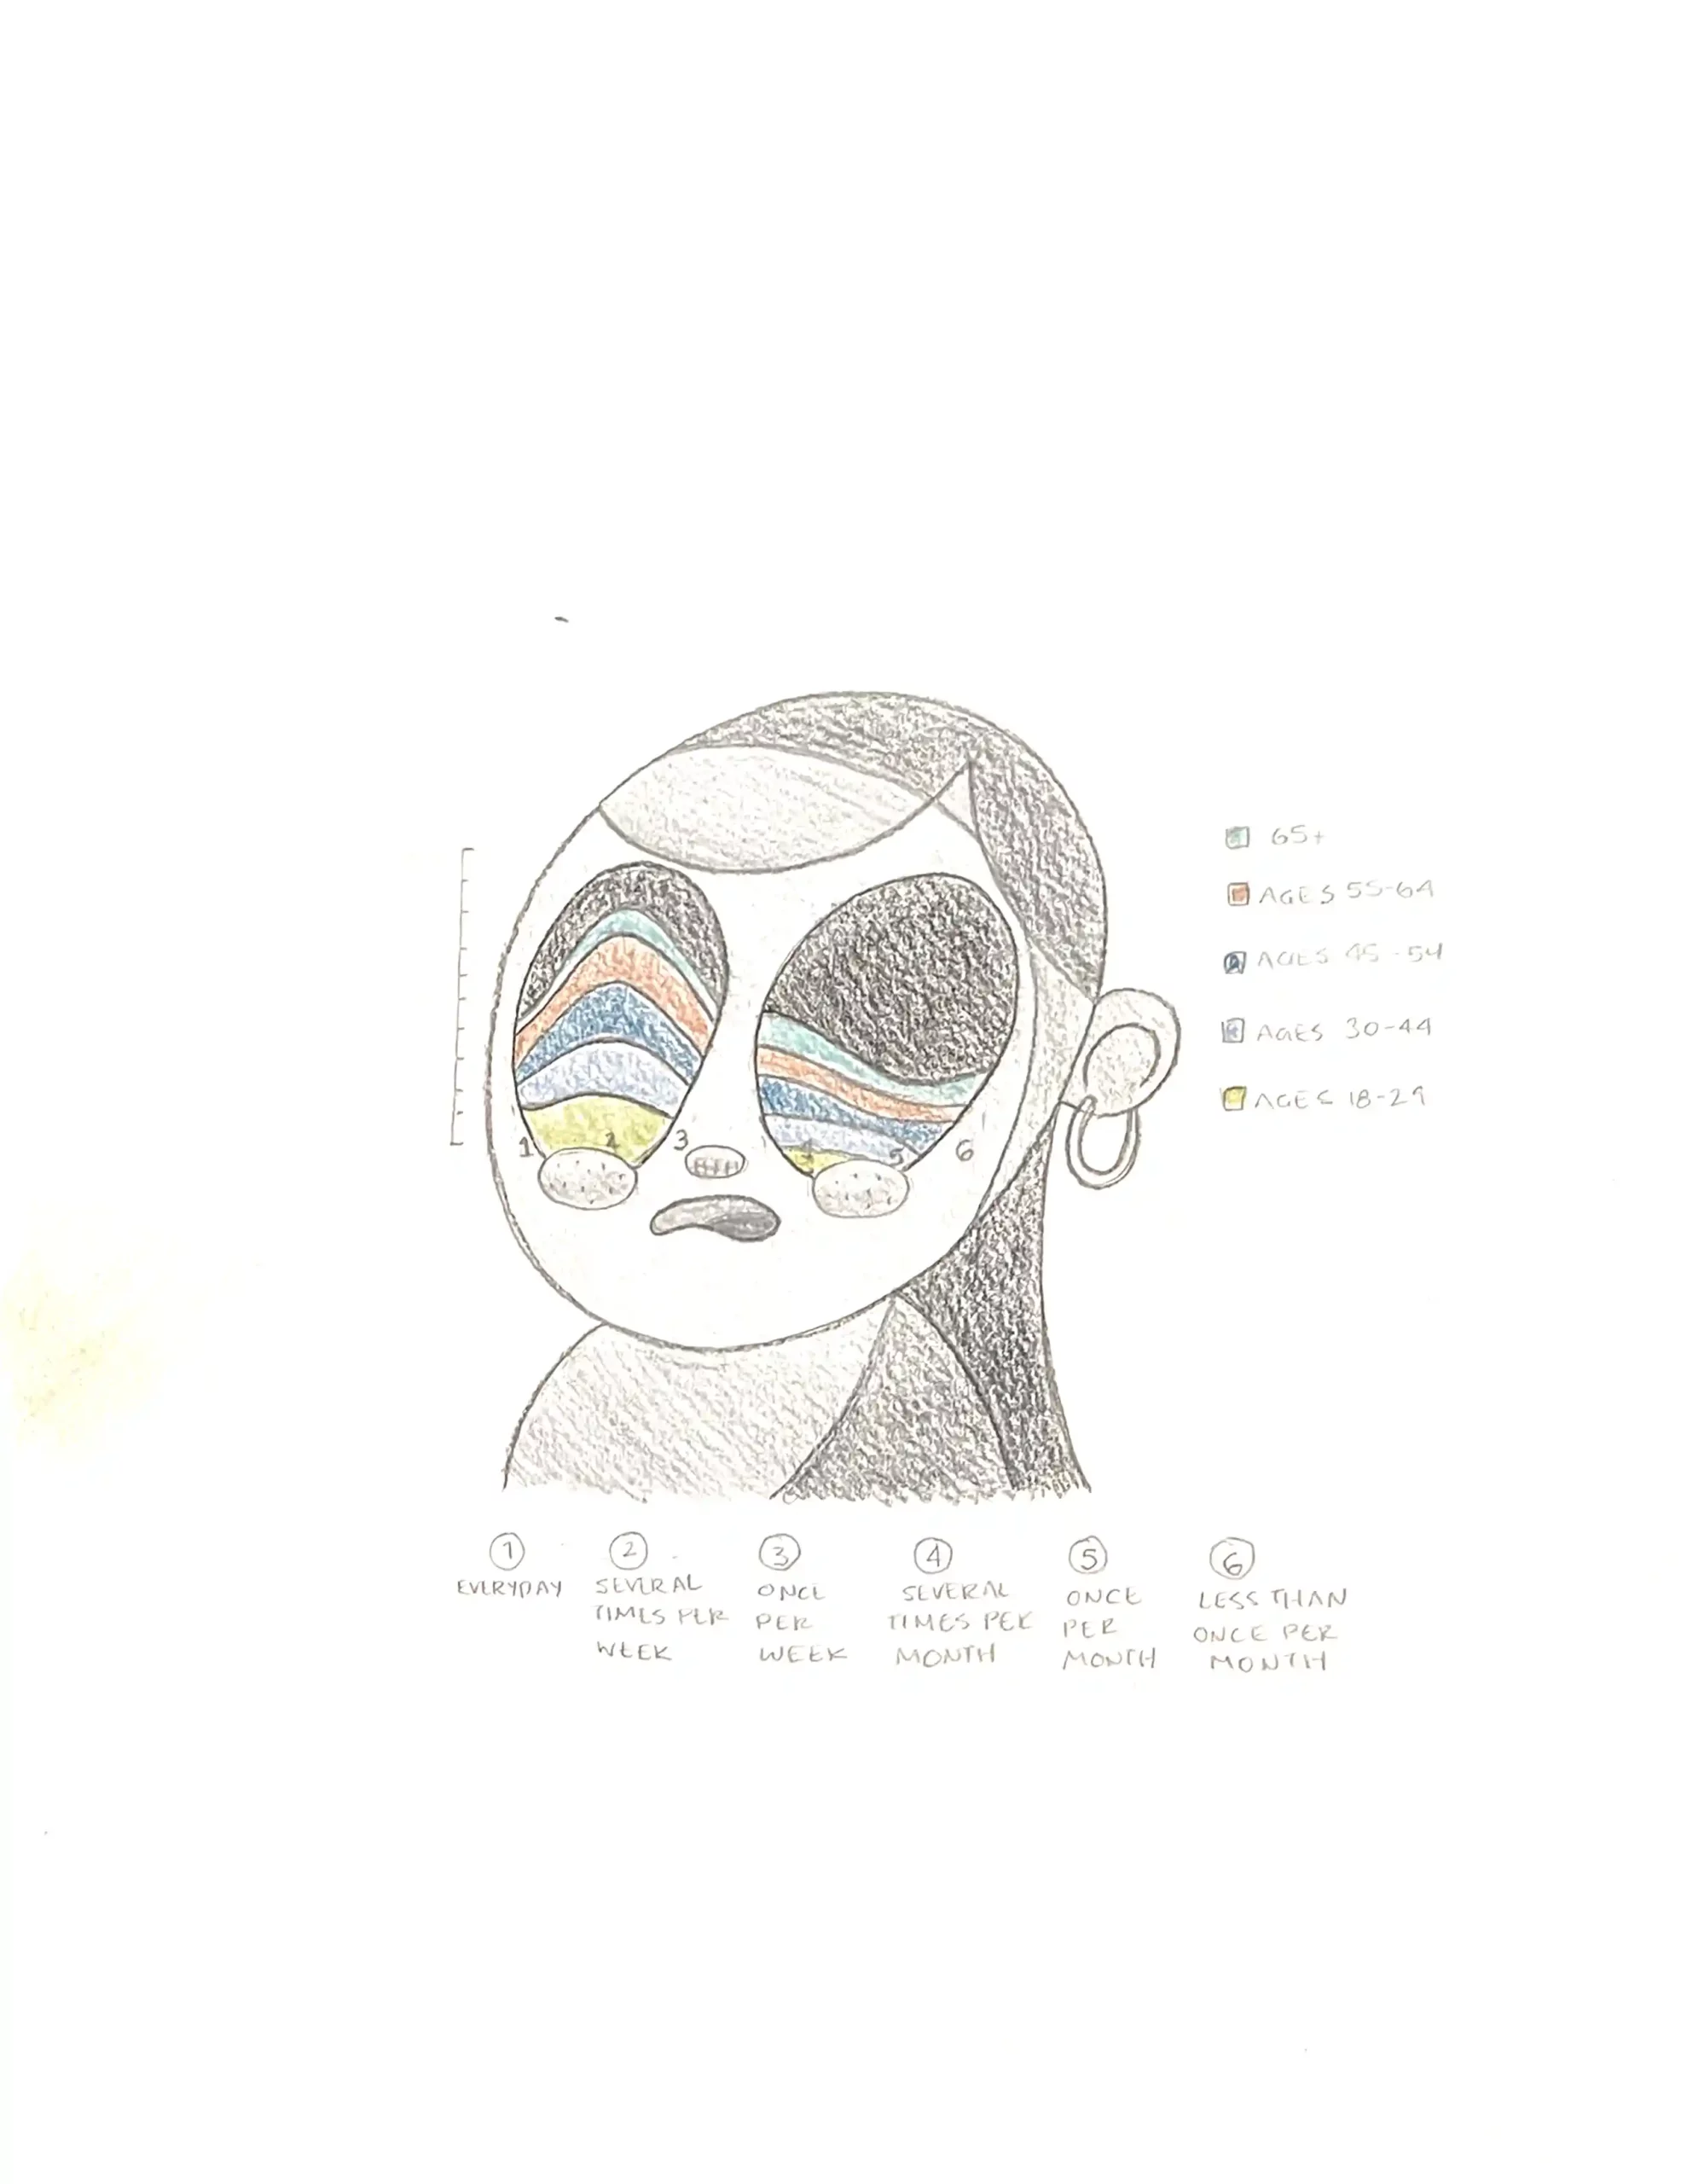
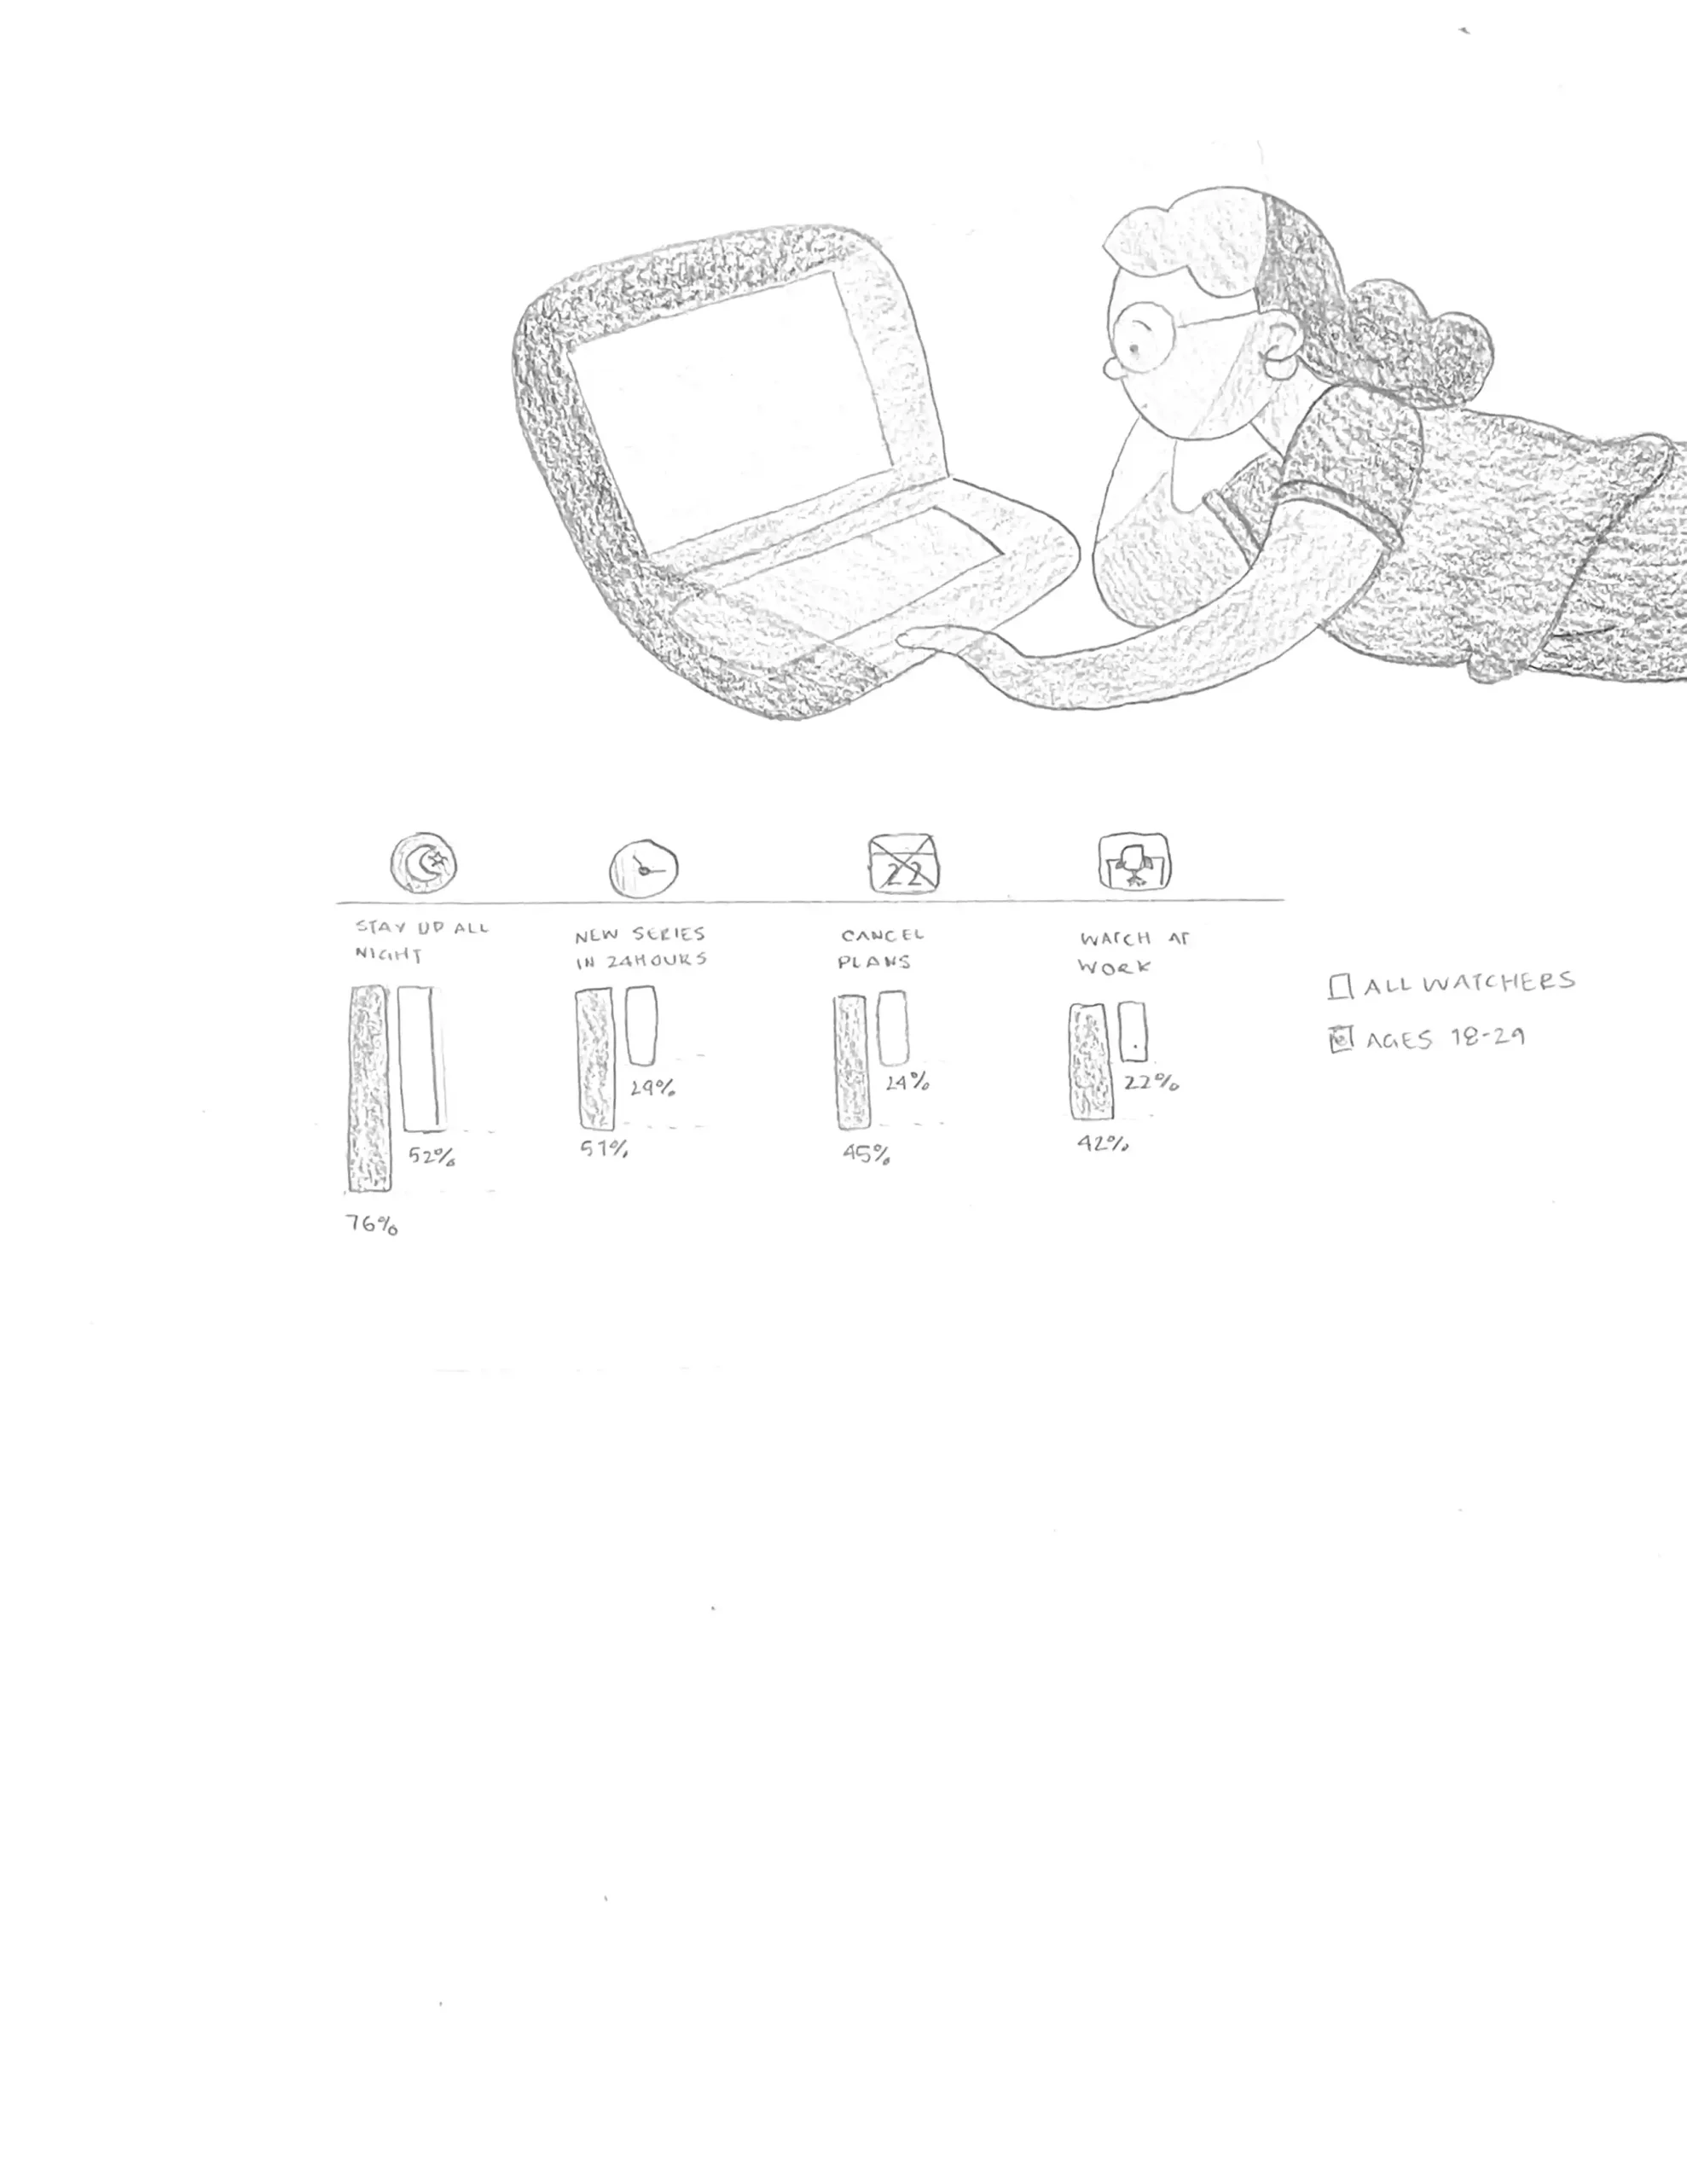
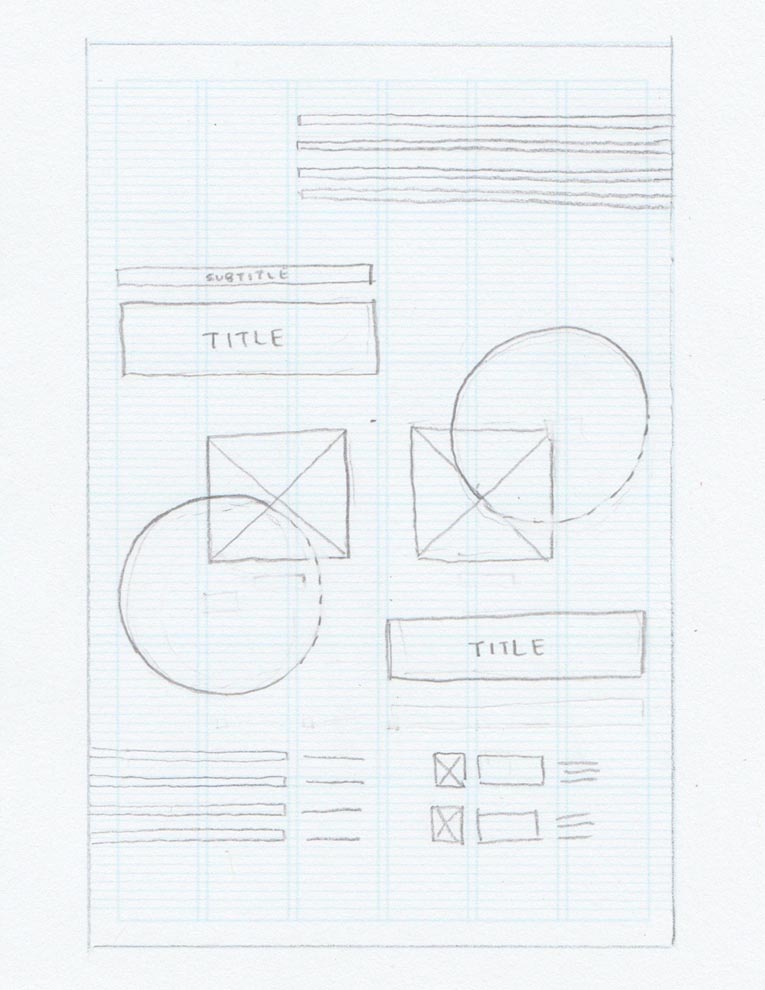
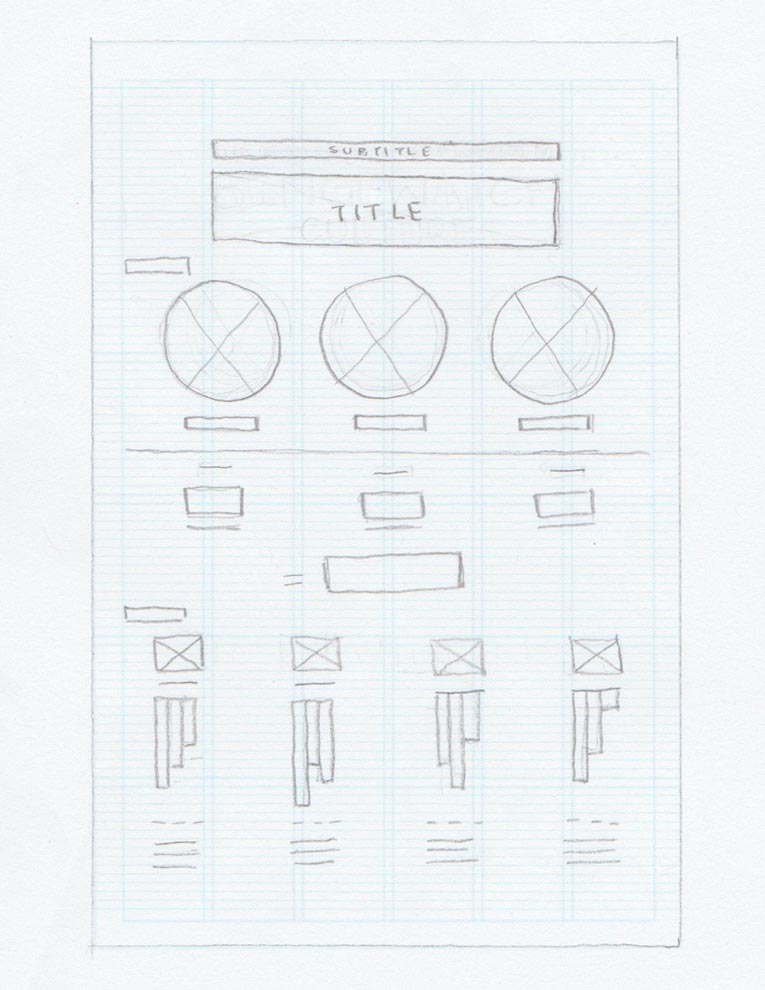
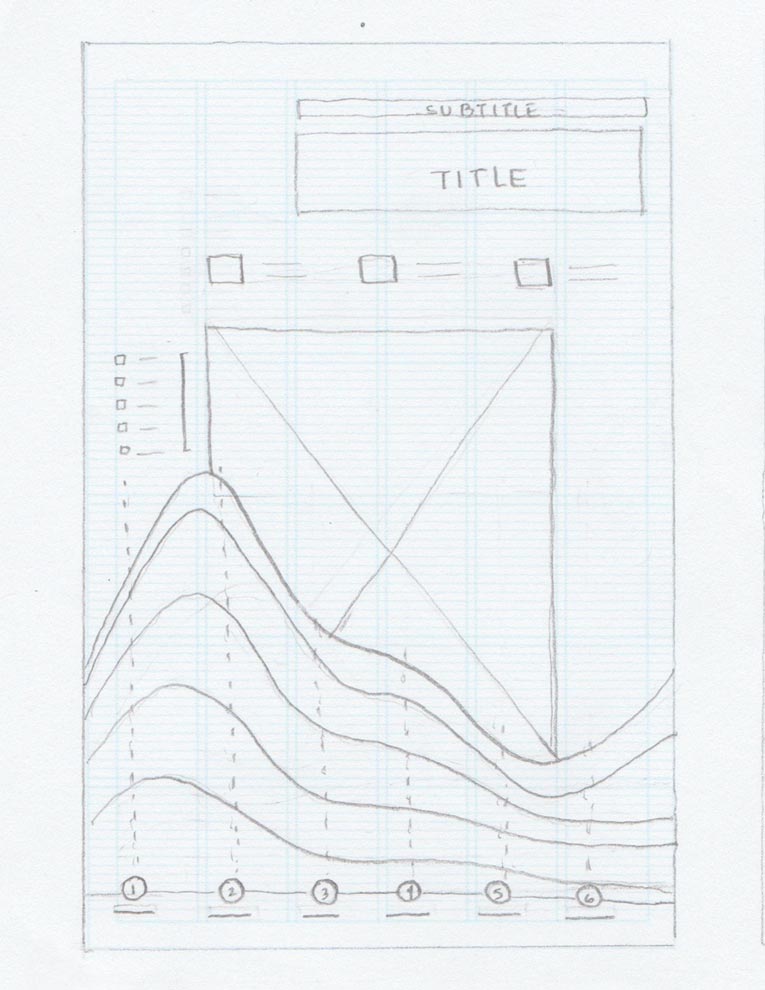
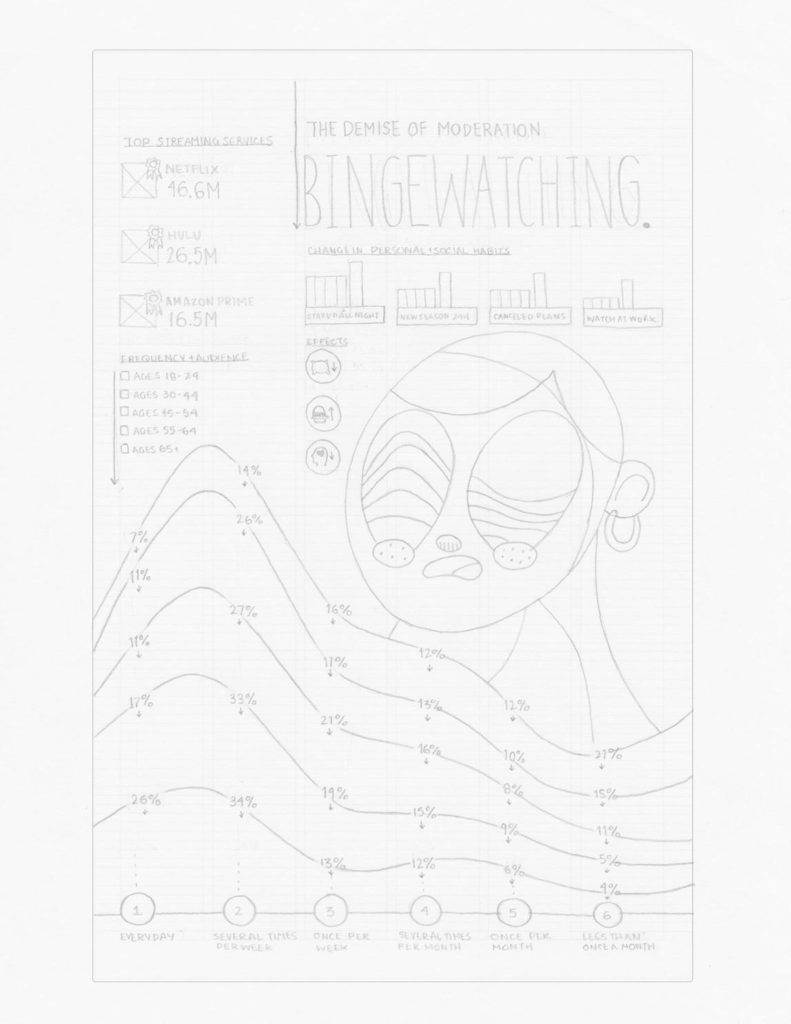
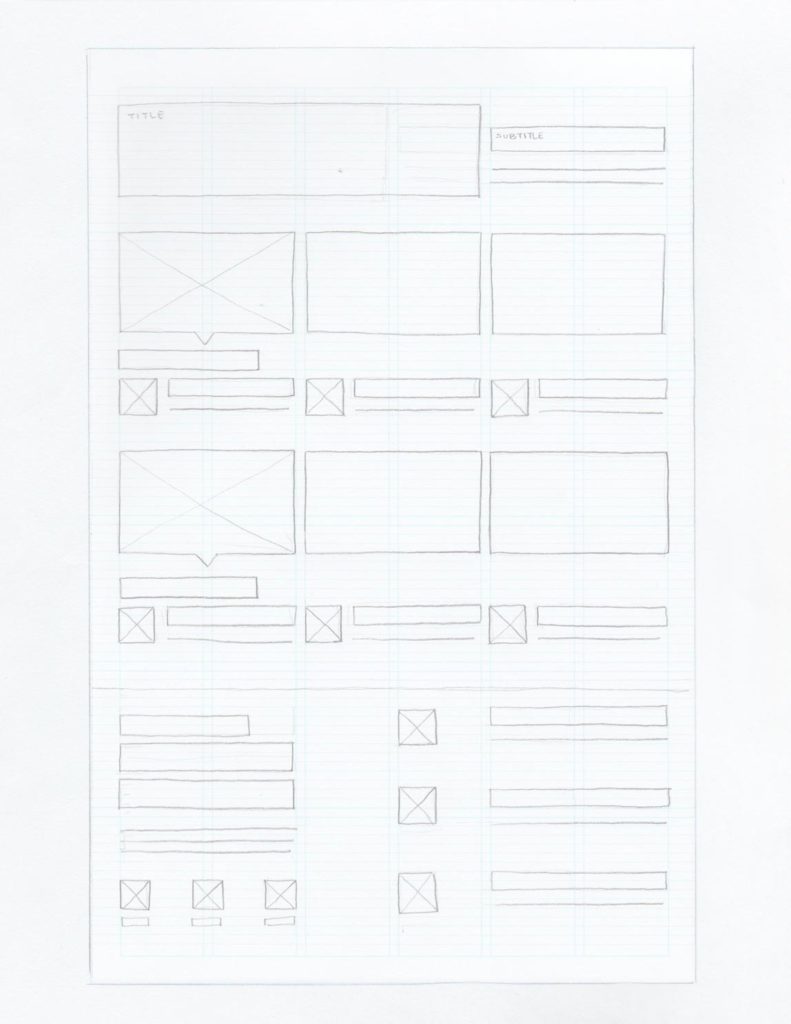
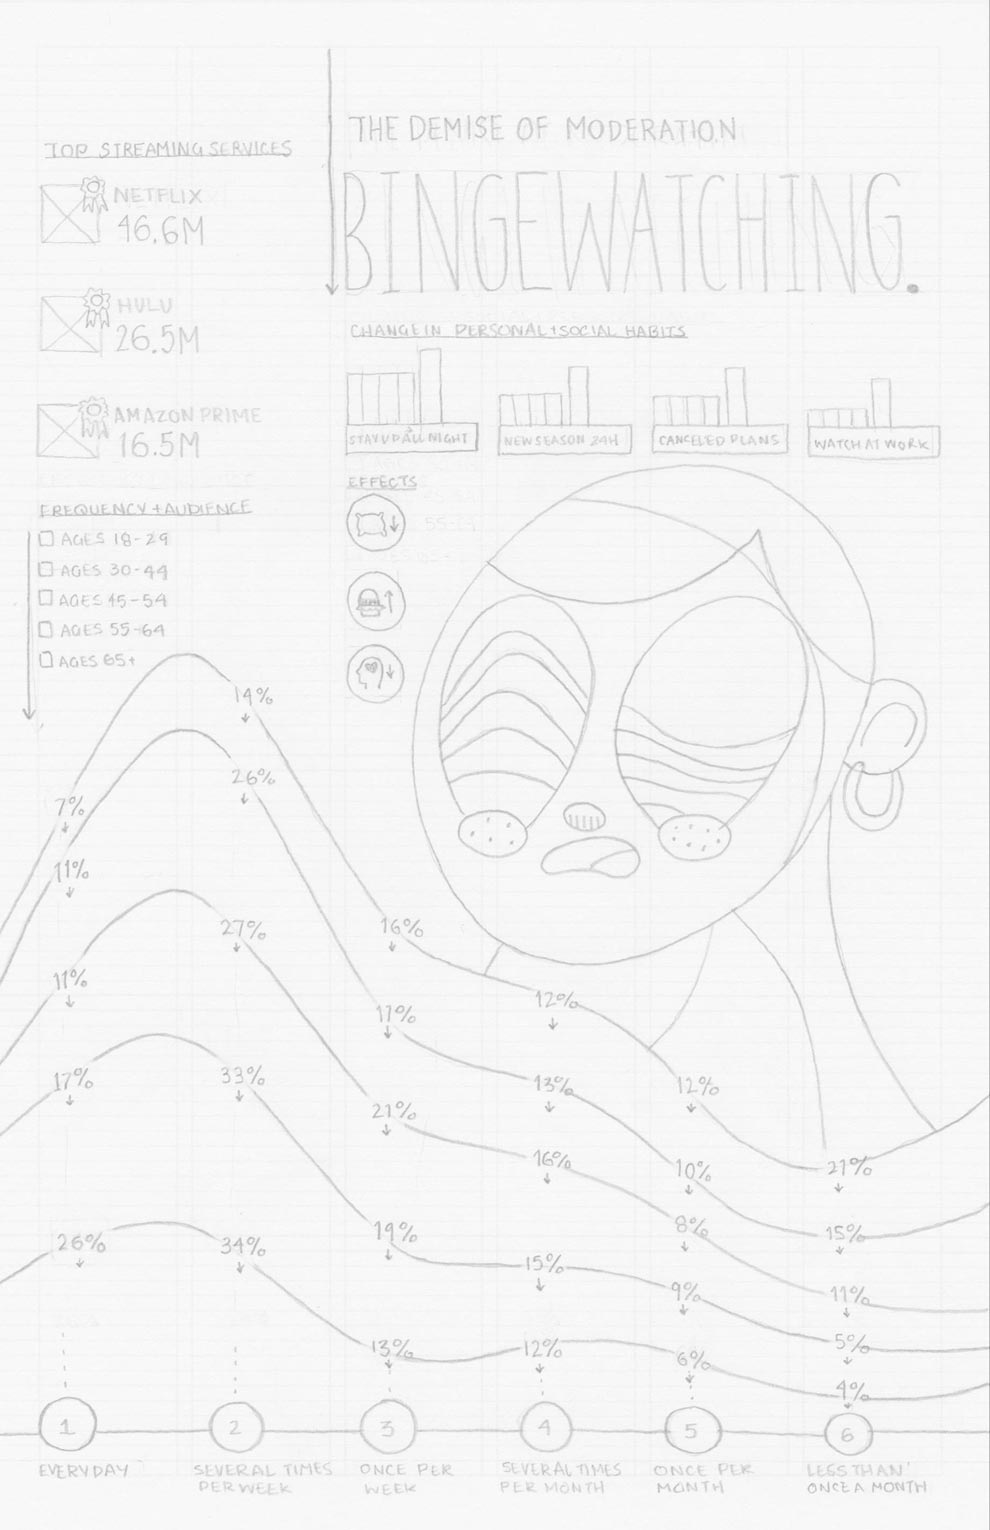
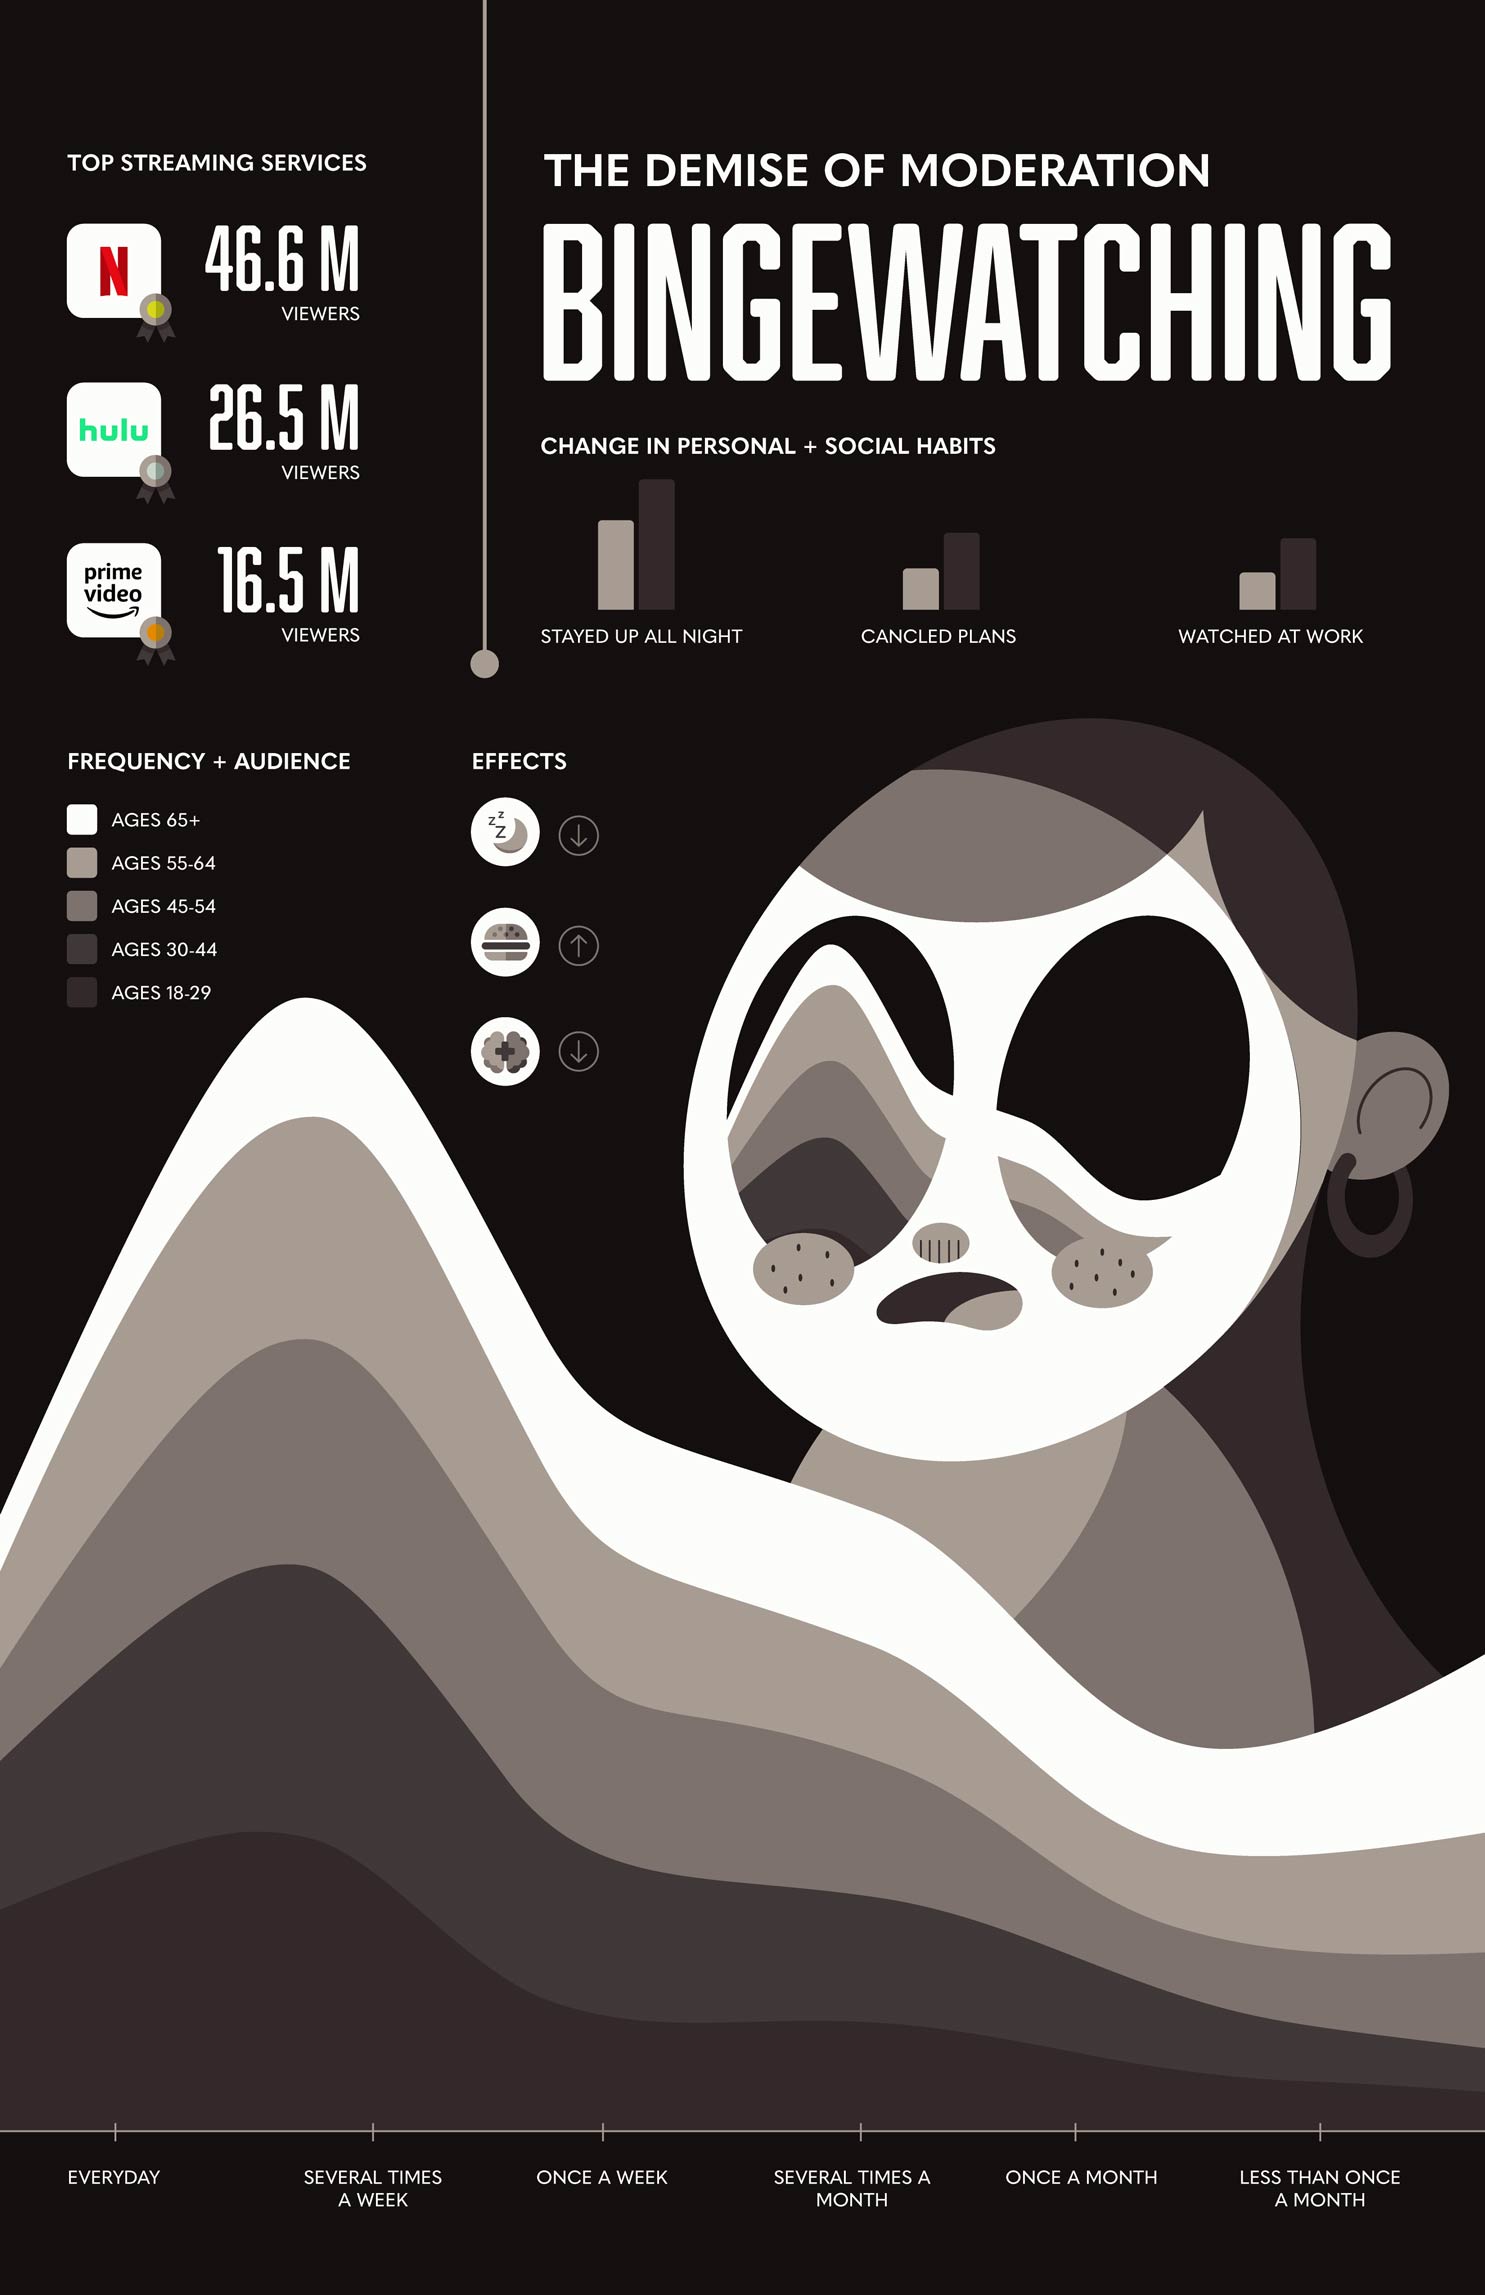
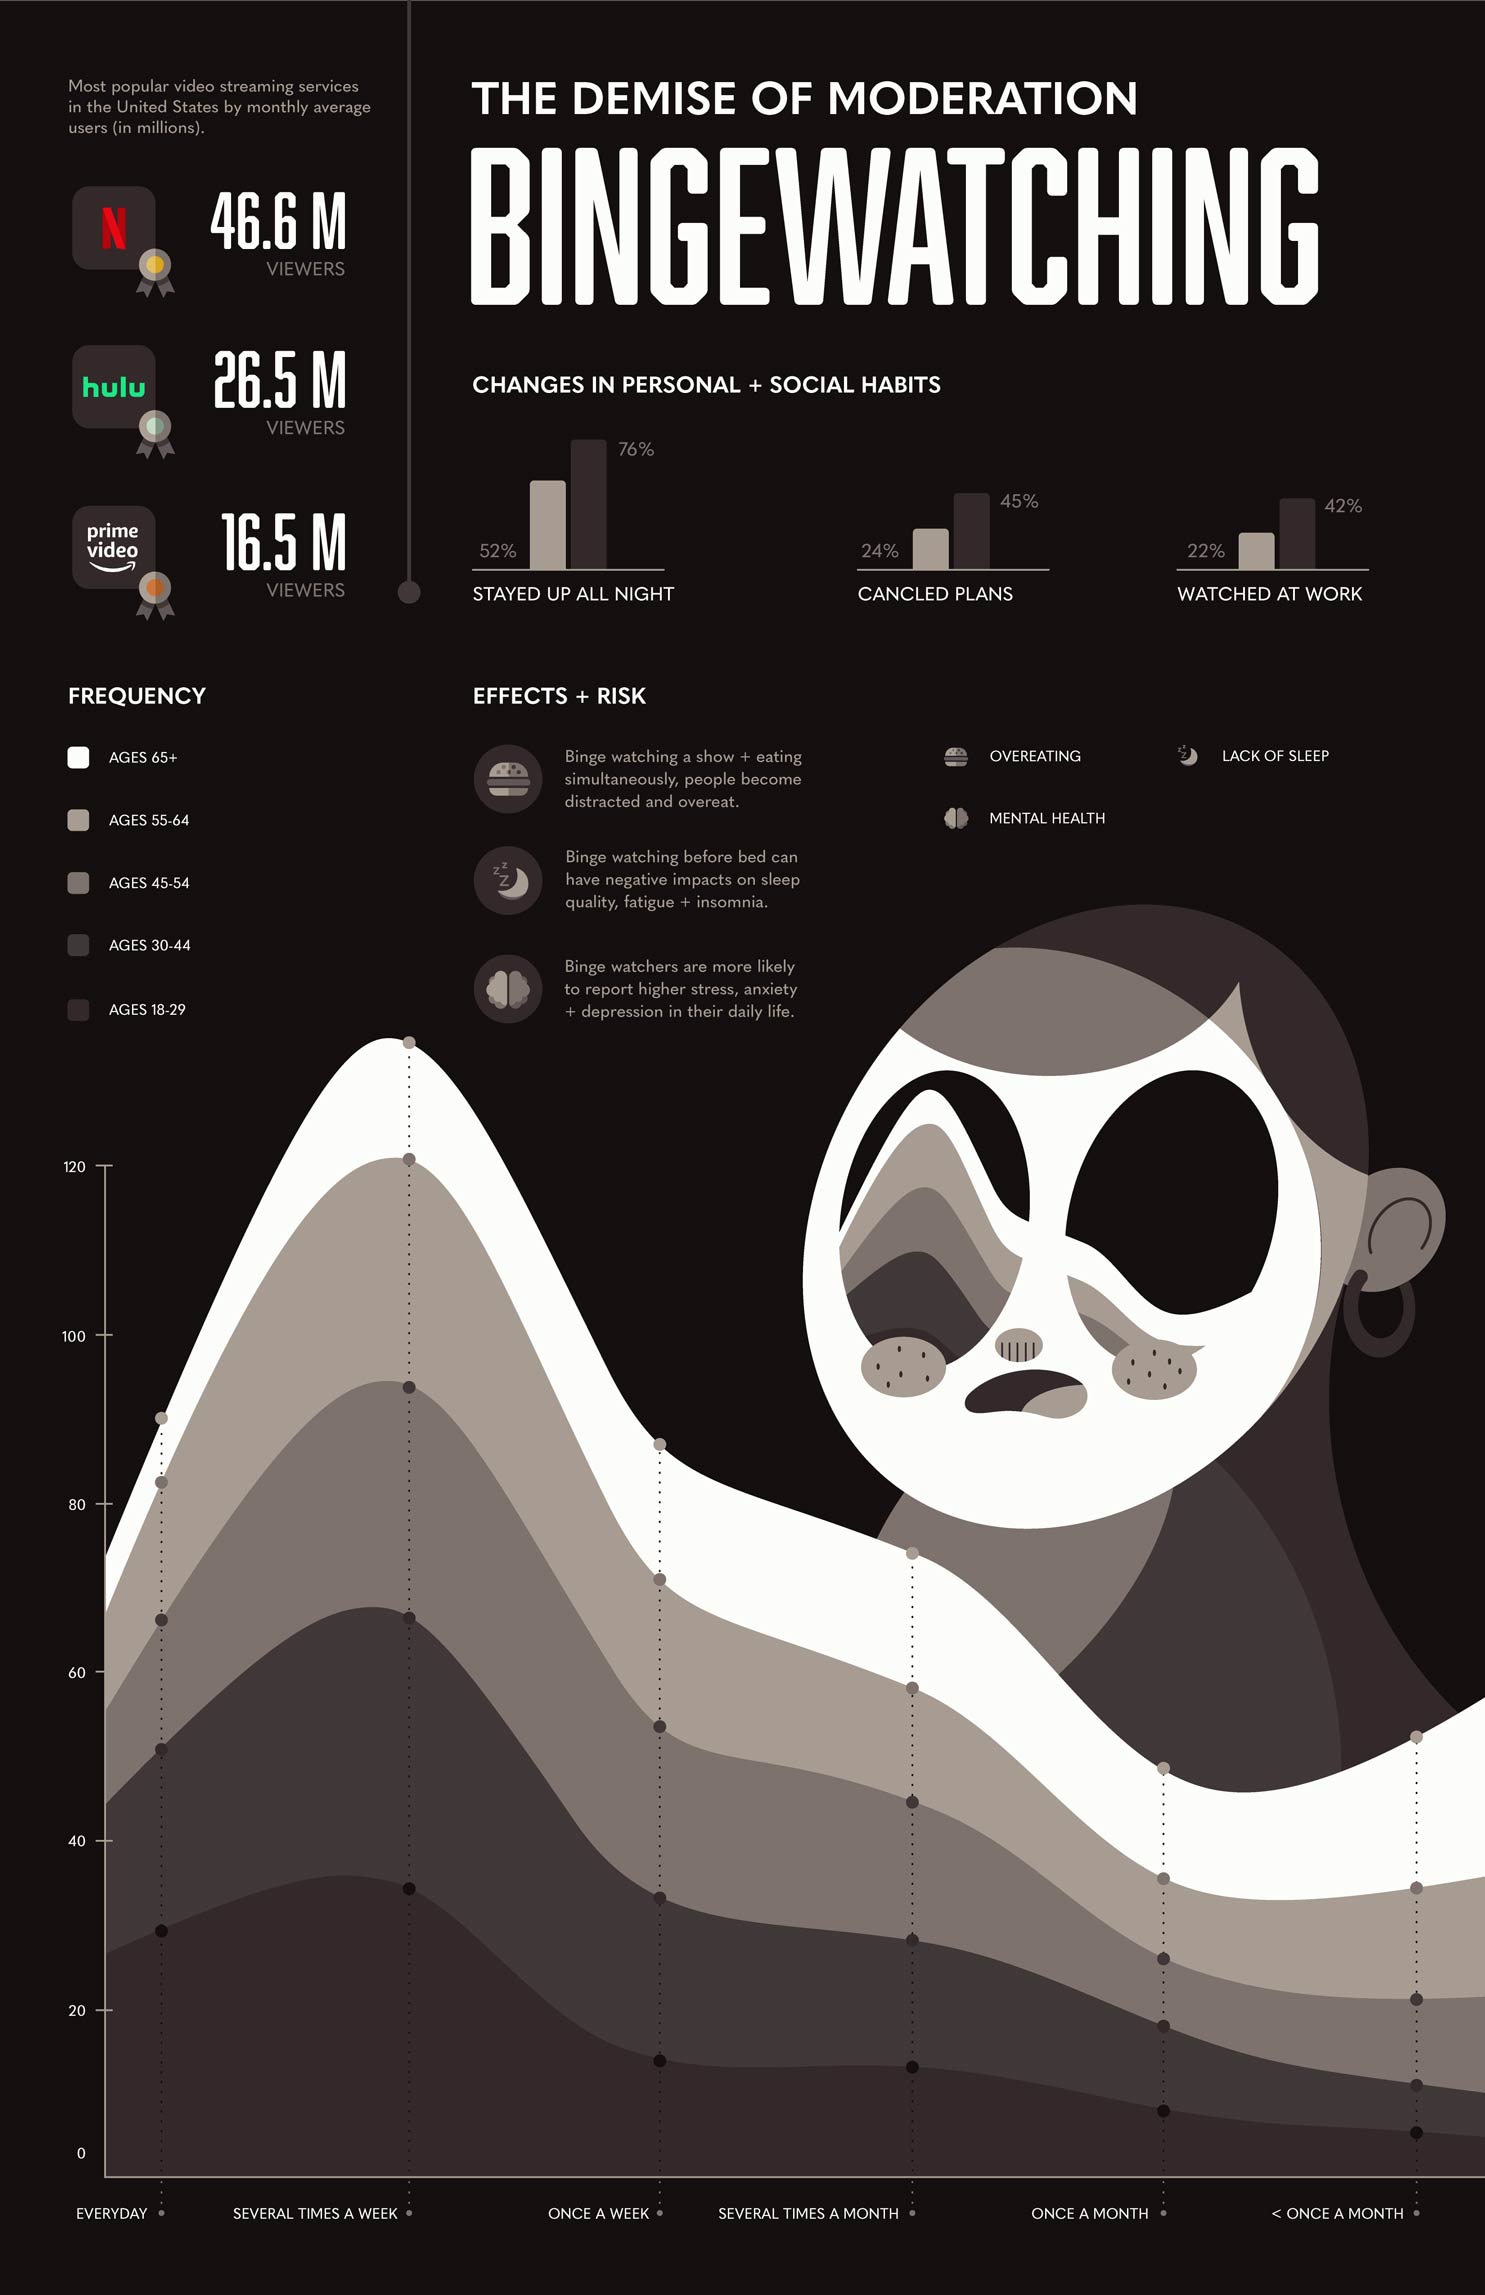
Sketching took place to visualize the data. Different grids were explored to see which one was most effective in organized the data. This was a three part process: initial data sketches, small macro sketches, and full size sketches.The styles/sketches were ranked for understandability and visual appeal and were revised based on insights and observations gained from peer reviews.
Visual System Guidelines
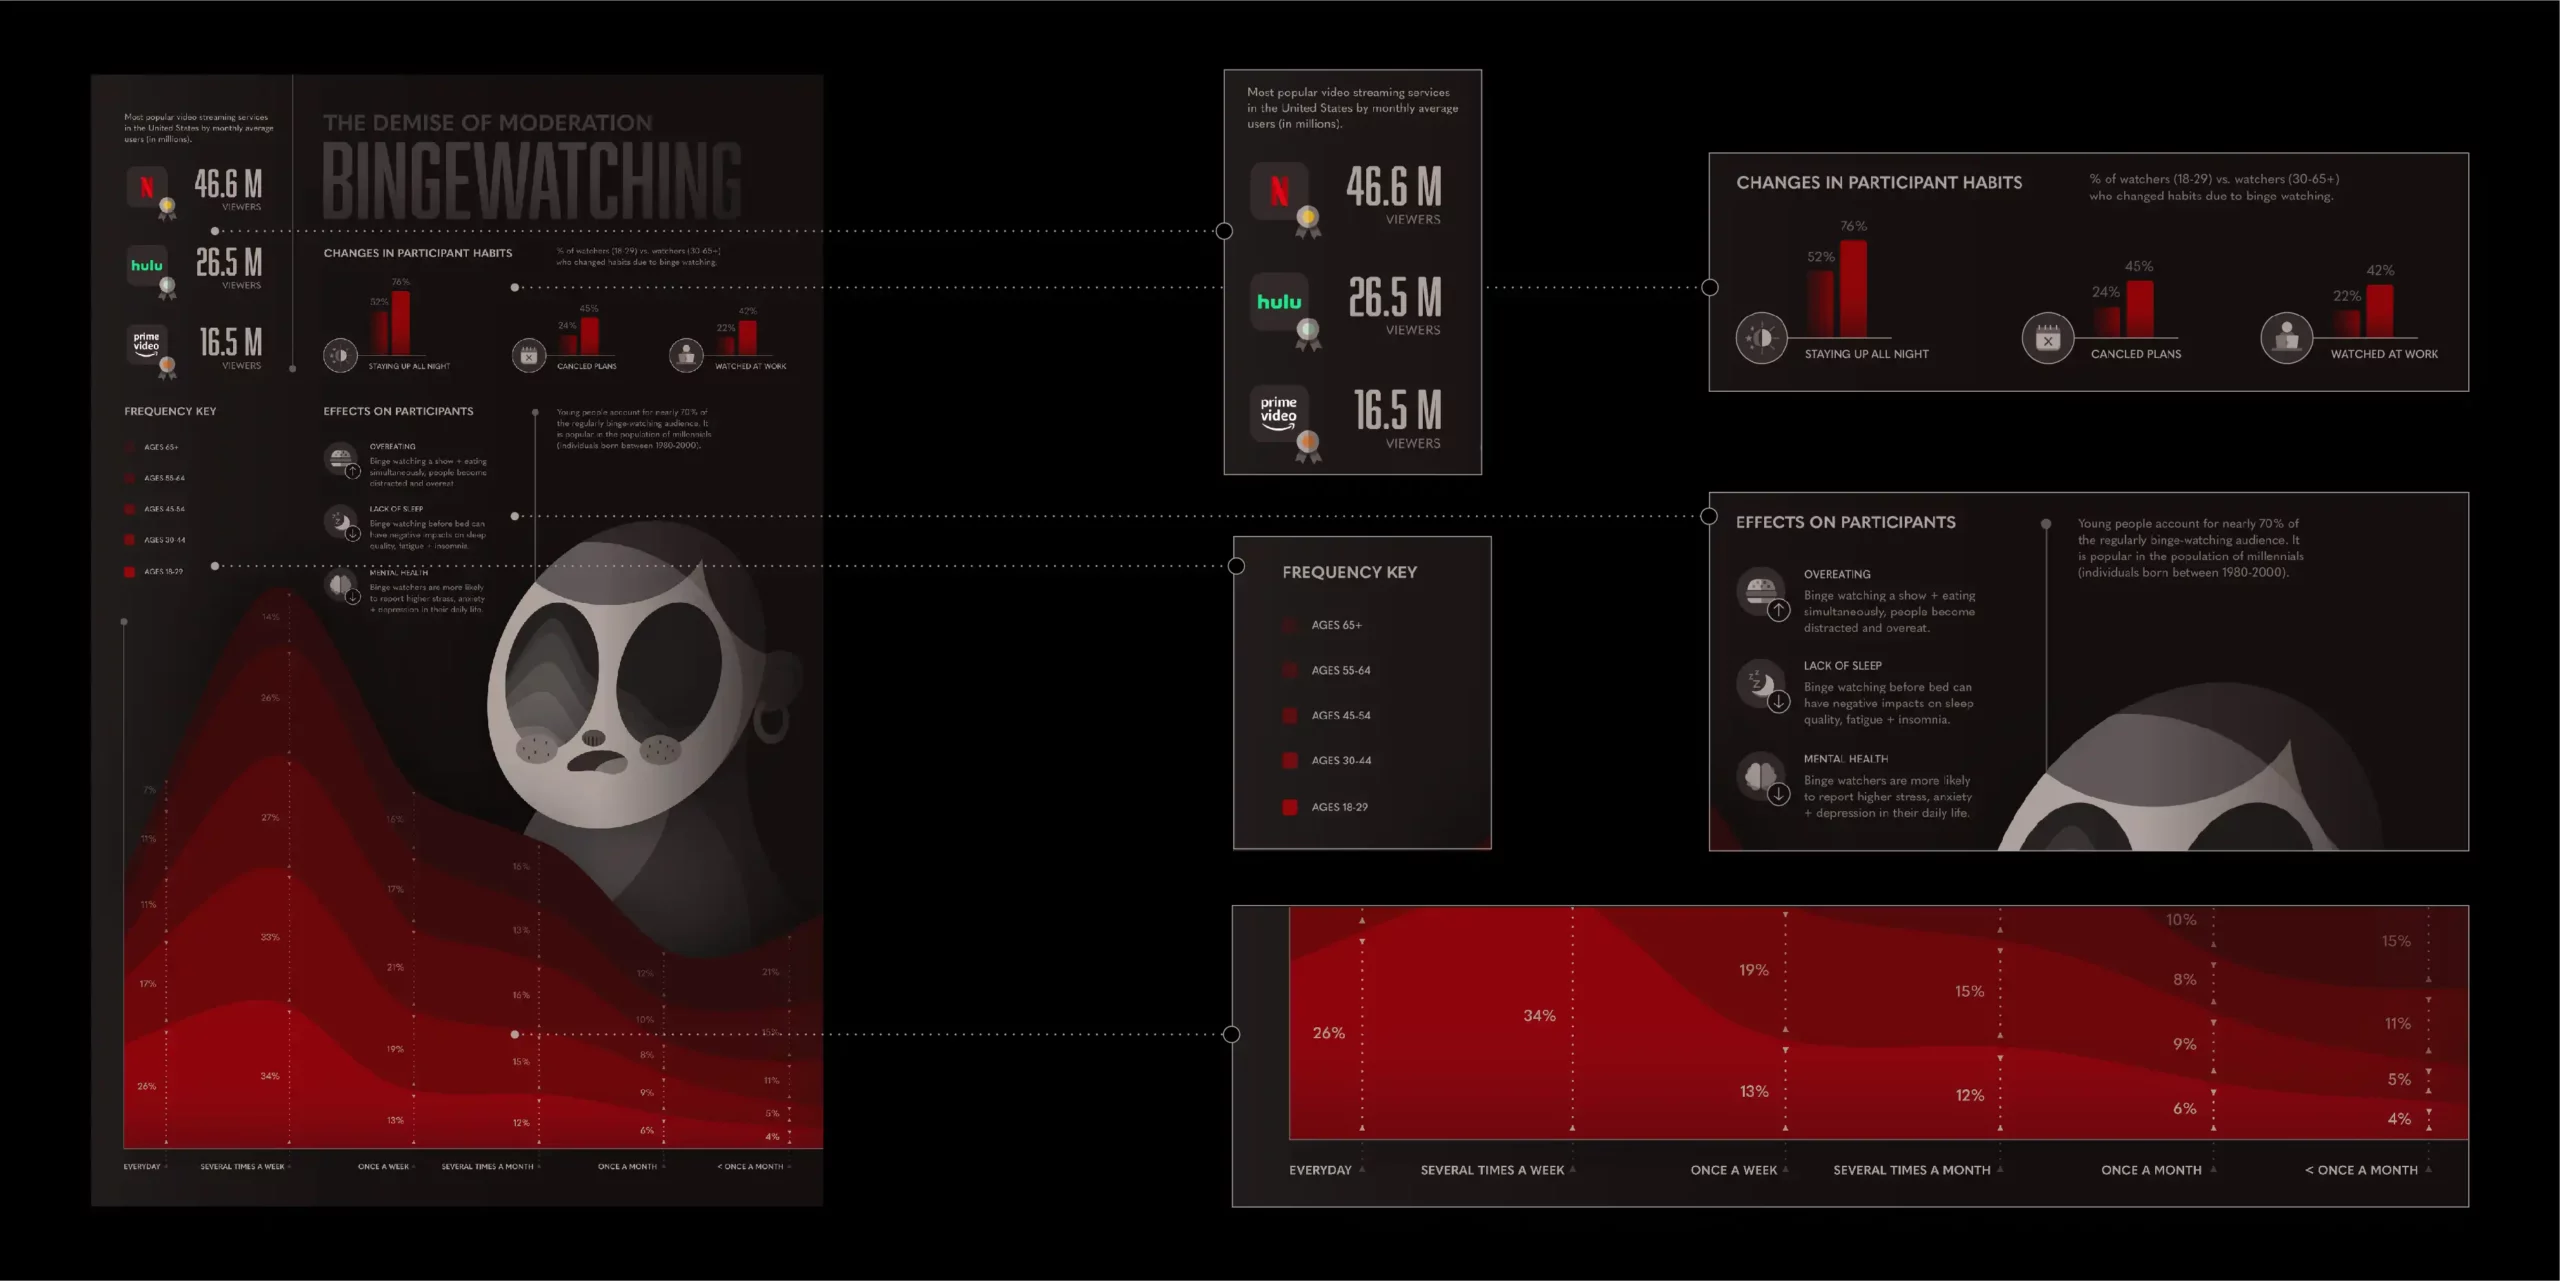
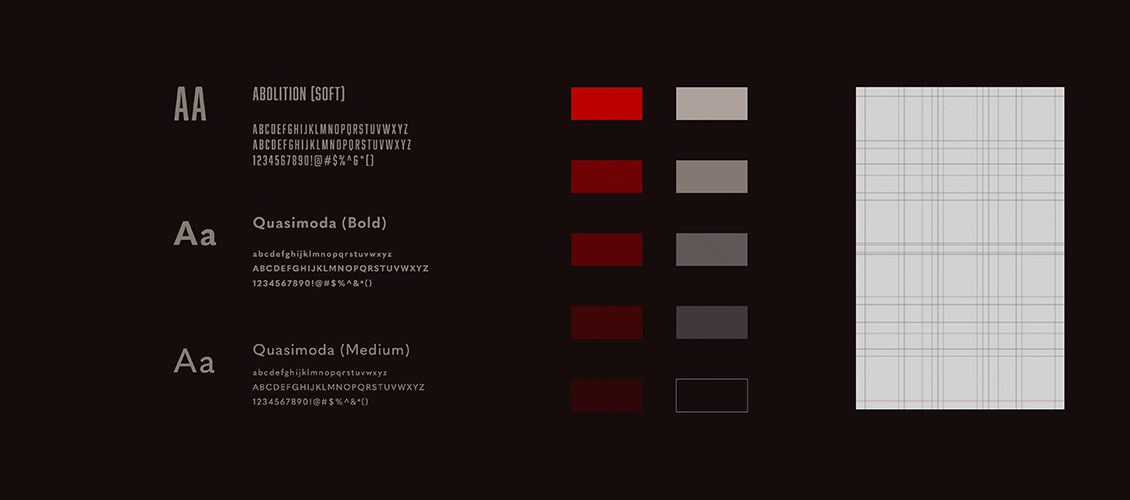
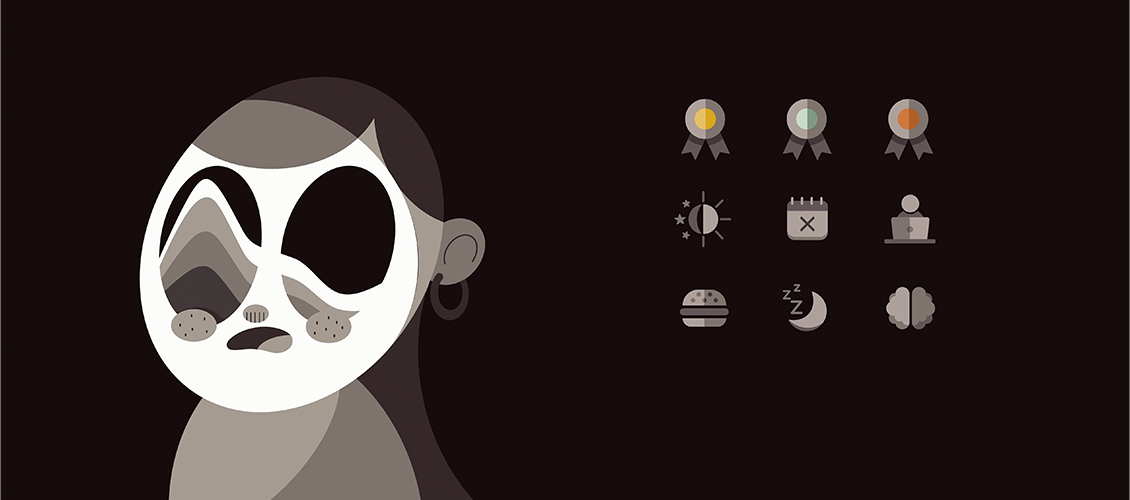
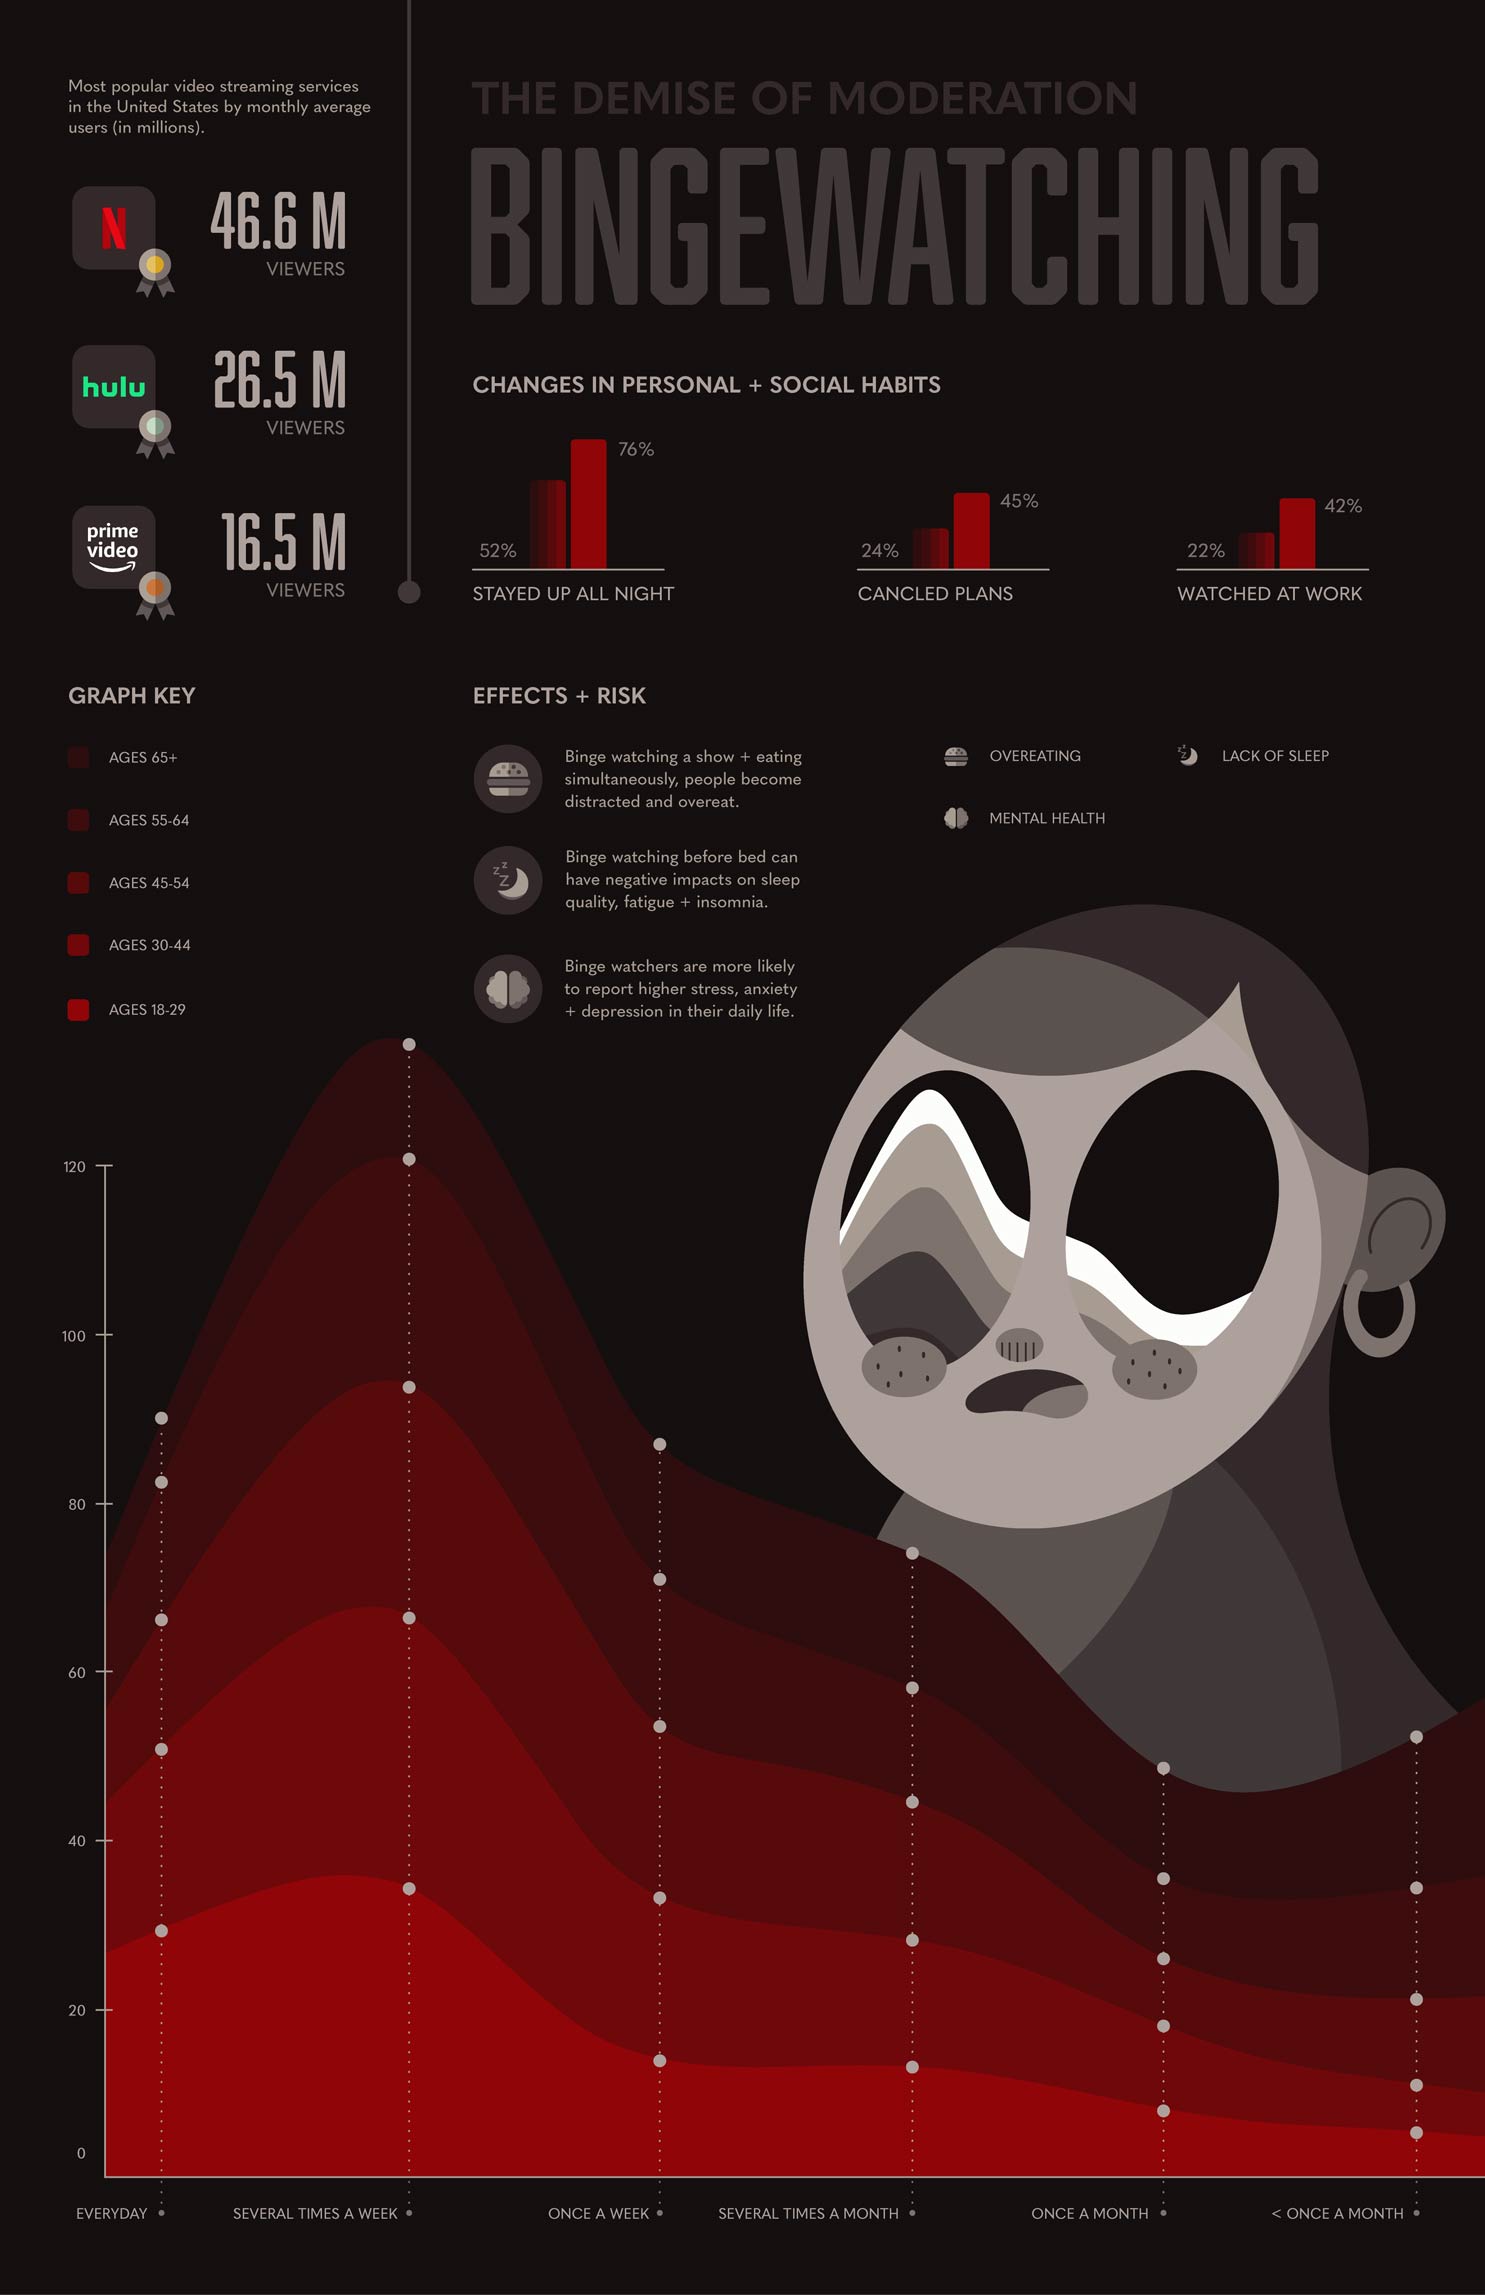
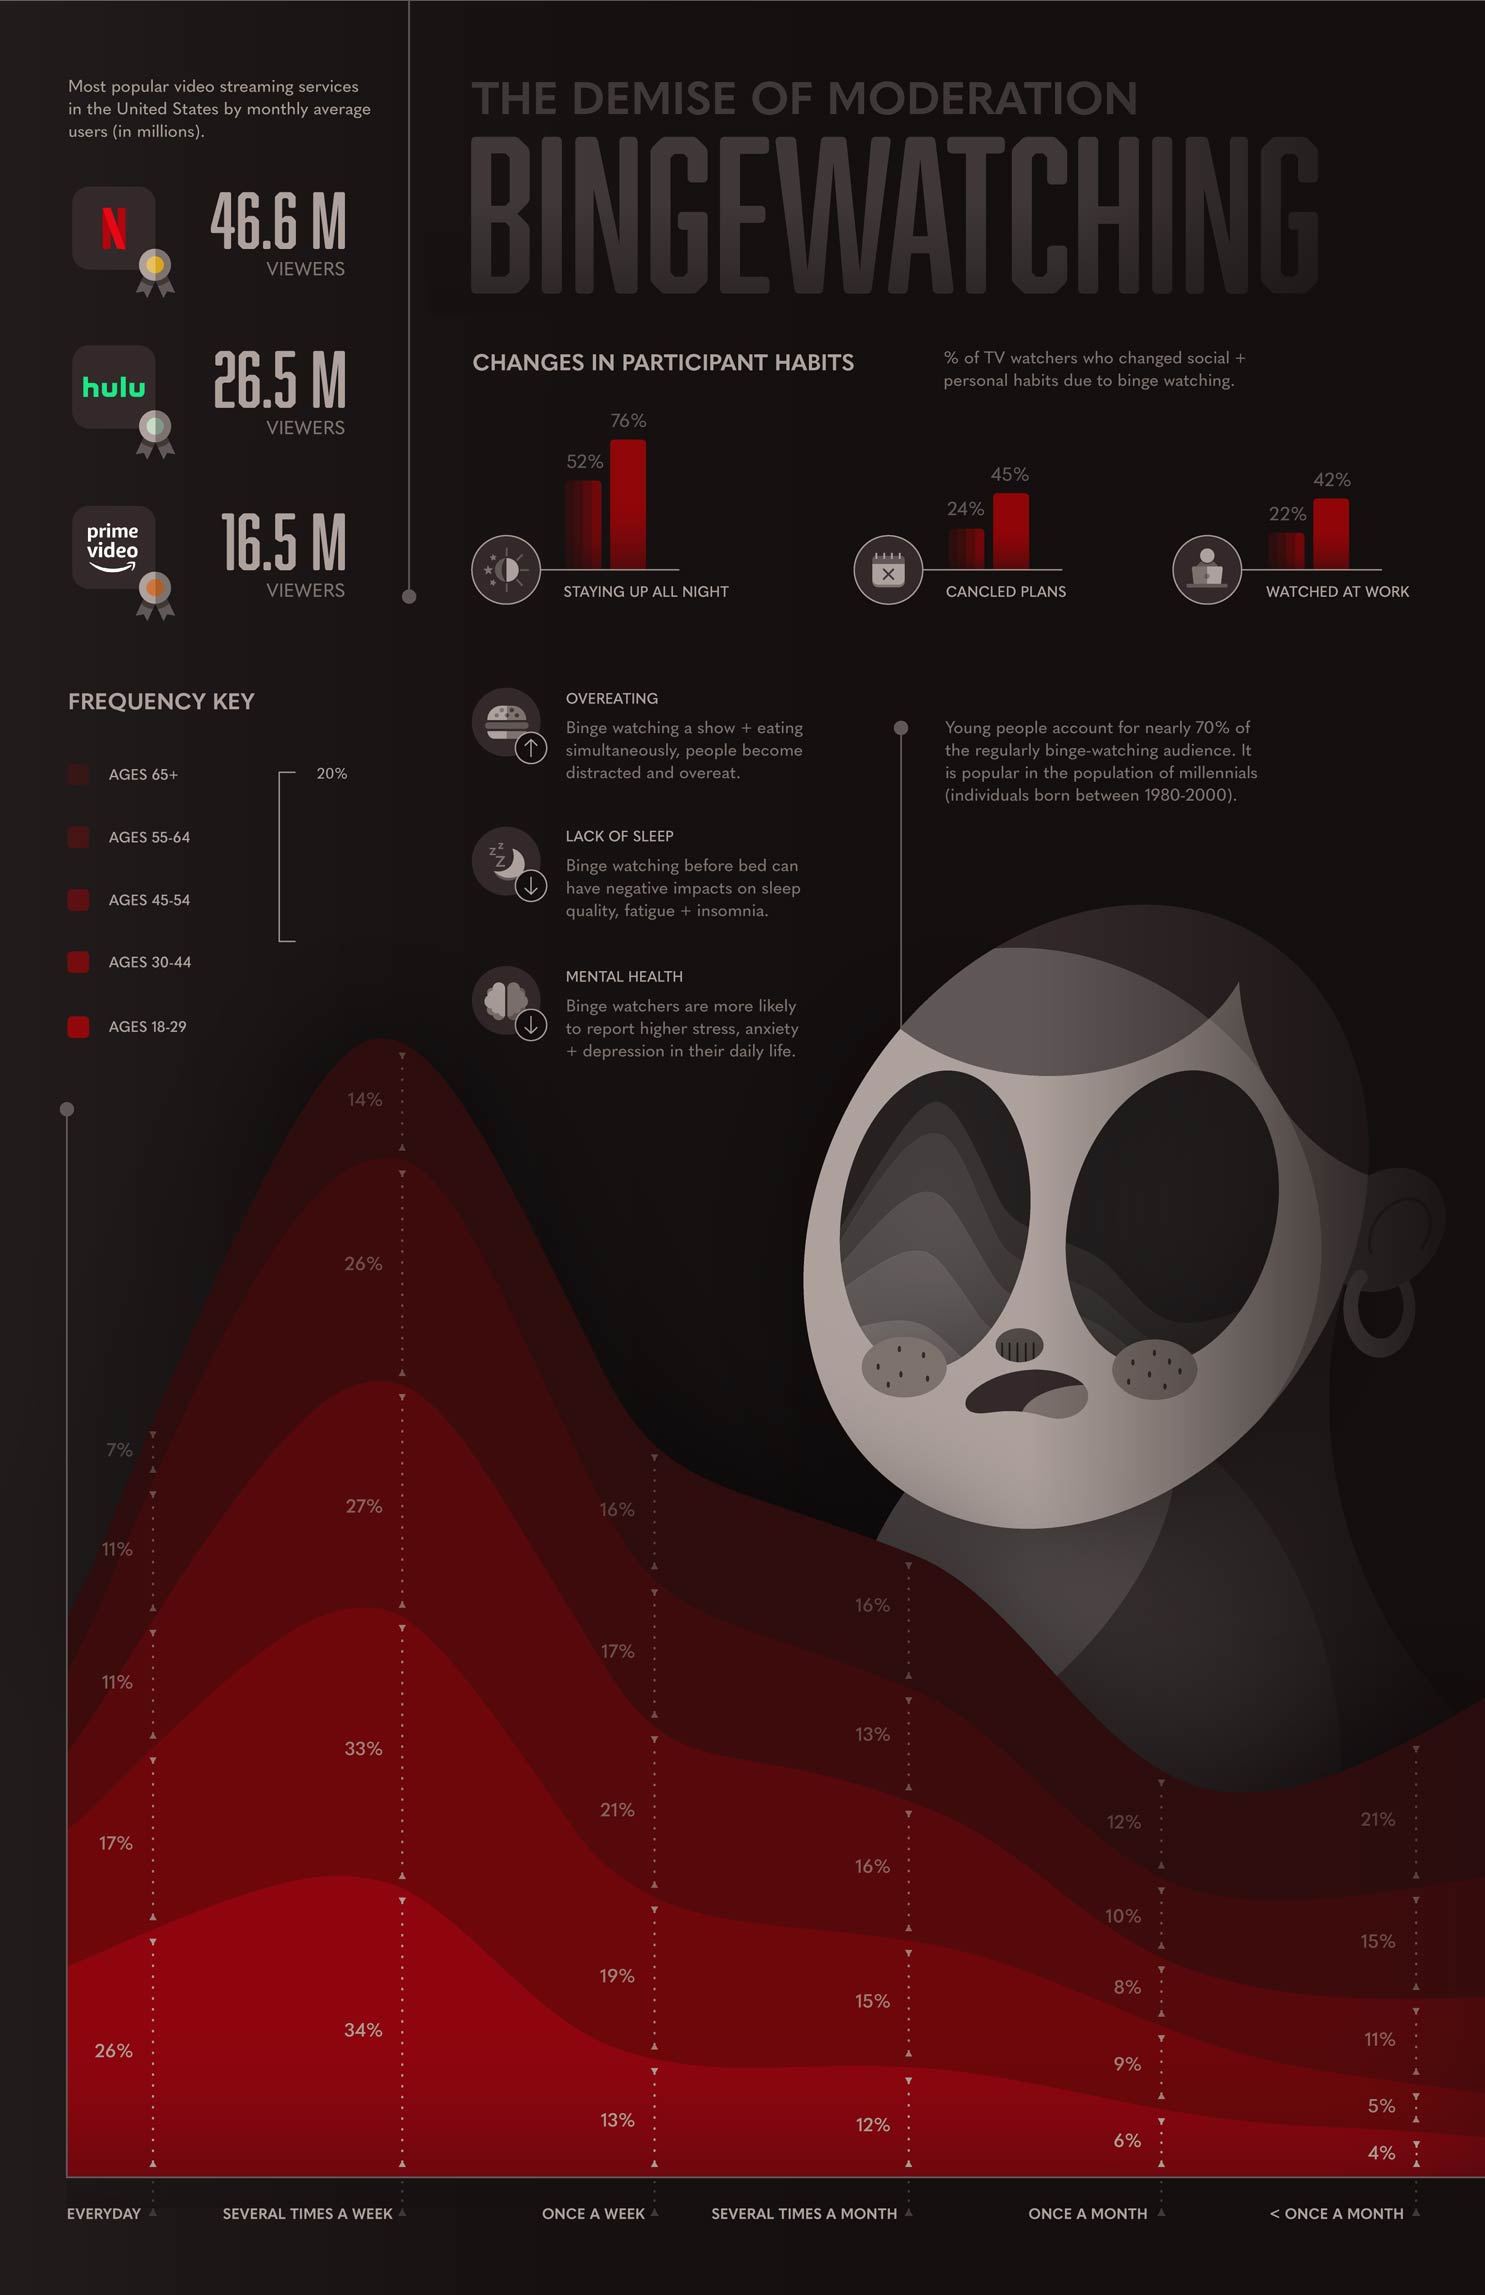
Establishing a system for the design was vital to maintain a cohesive design. Type, color, grid, icons, photographic concept were laid out and guided the digital exploration. Graphic imagery was created to serve as a focal point for the poster and was used to grab audience attention. Additional icons were creqated in a similar style to help guide the user through the content.
Digital Puzzle Pieces
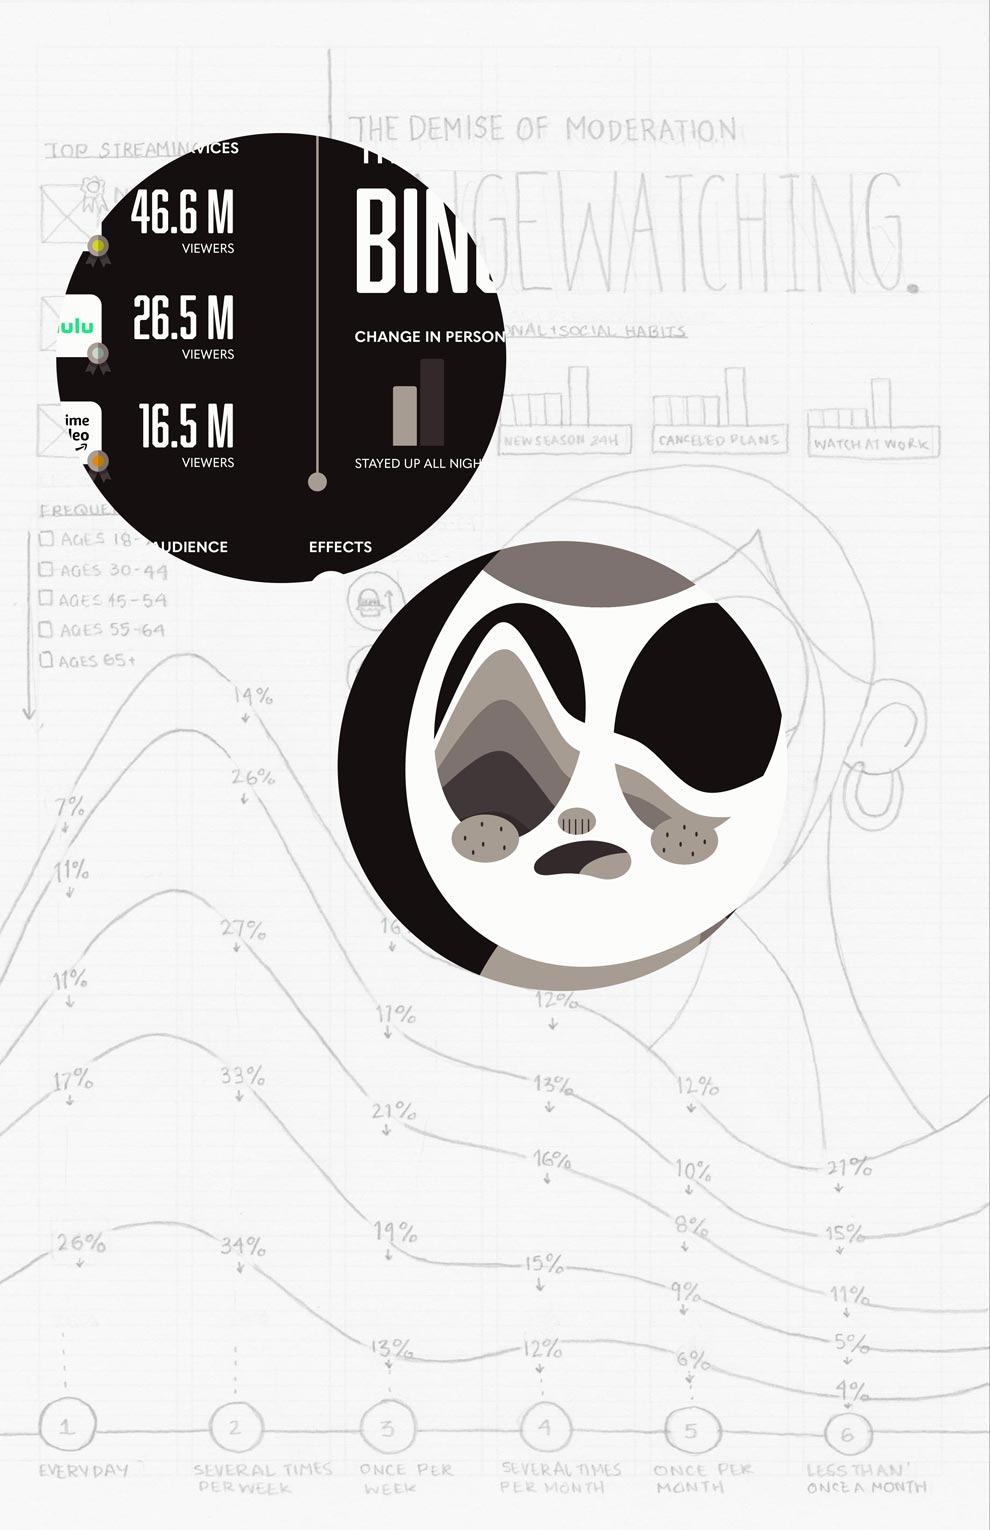
Two circular, 5 x 5 circular “puzzle pieces” were created using the set Visual Systems guidelines. Only items within the circle (type, color, image) were designed. The areas that were chosen were complex and hosted many micro and macro elements. This process was used to inform the visual intent of the piece and to further define the informational content featured on the sketch.
Final and Digital Iterations
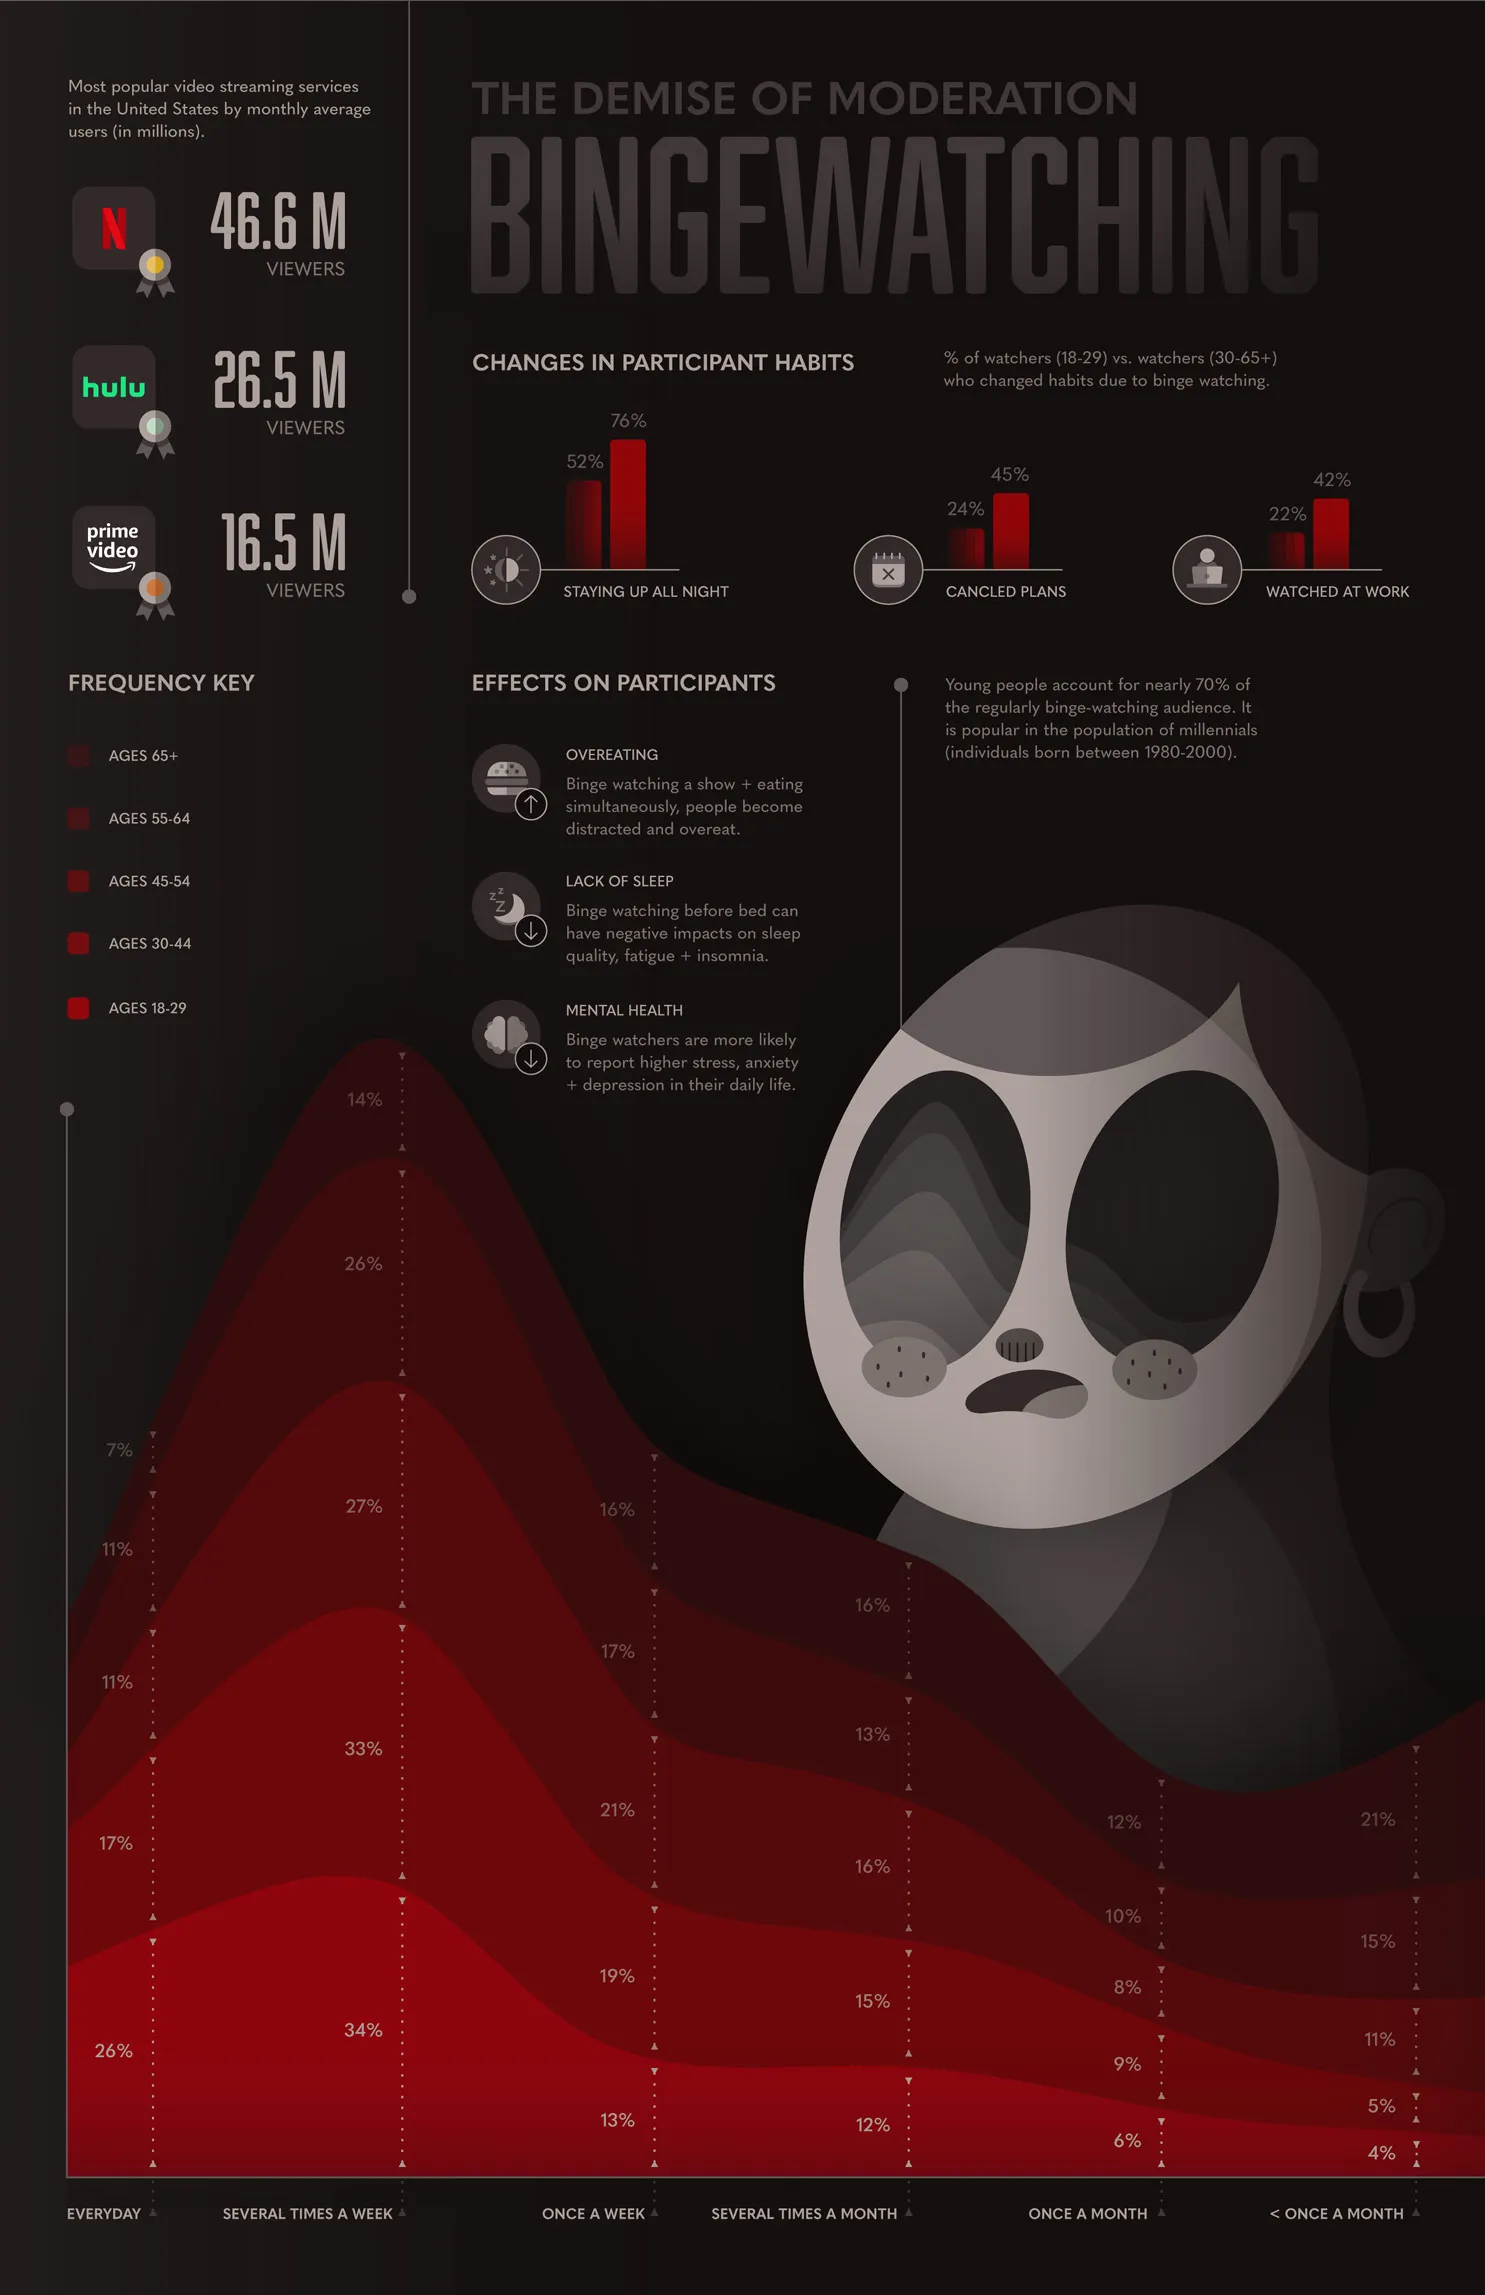
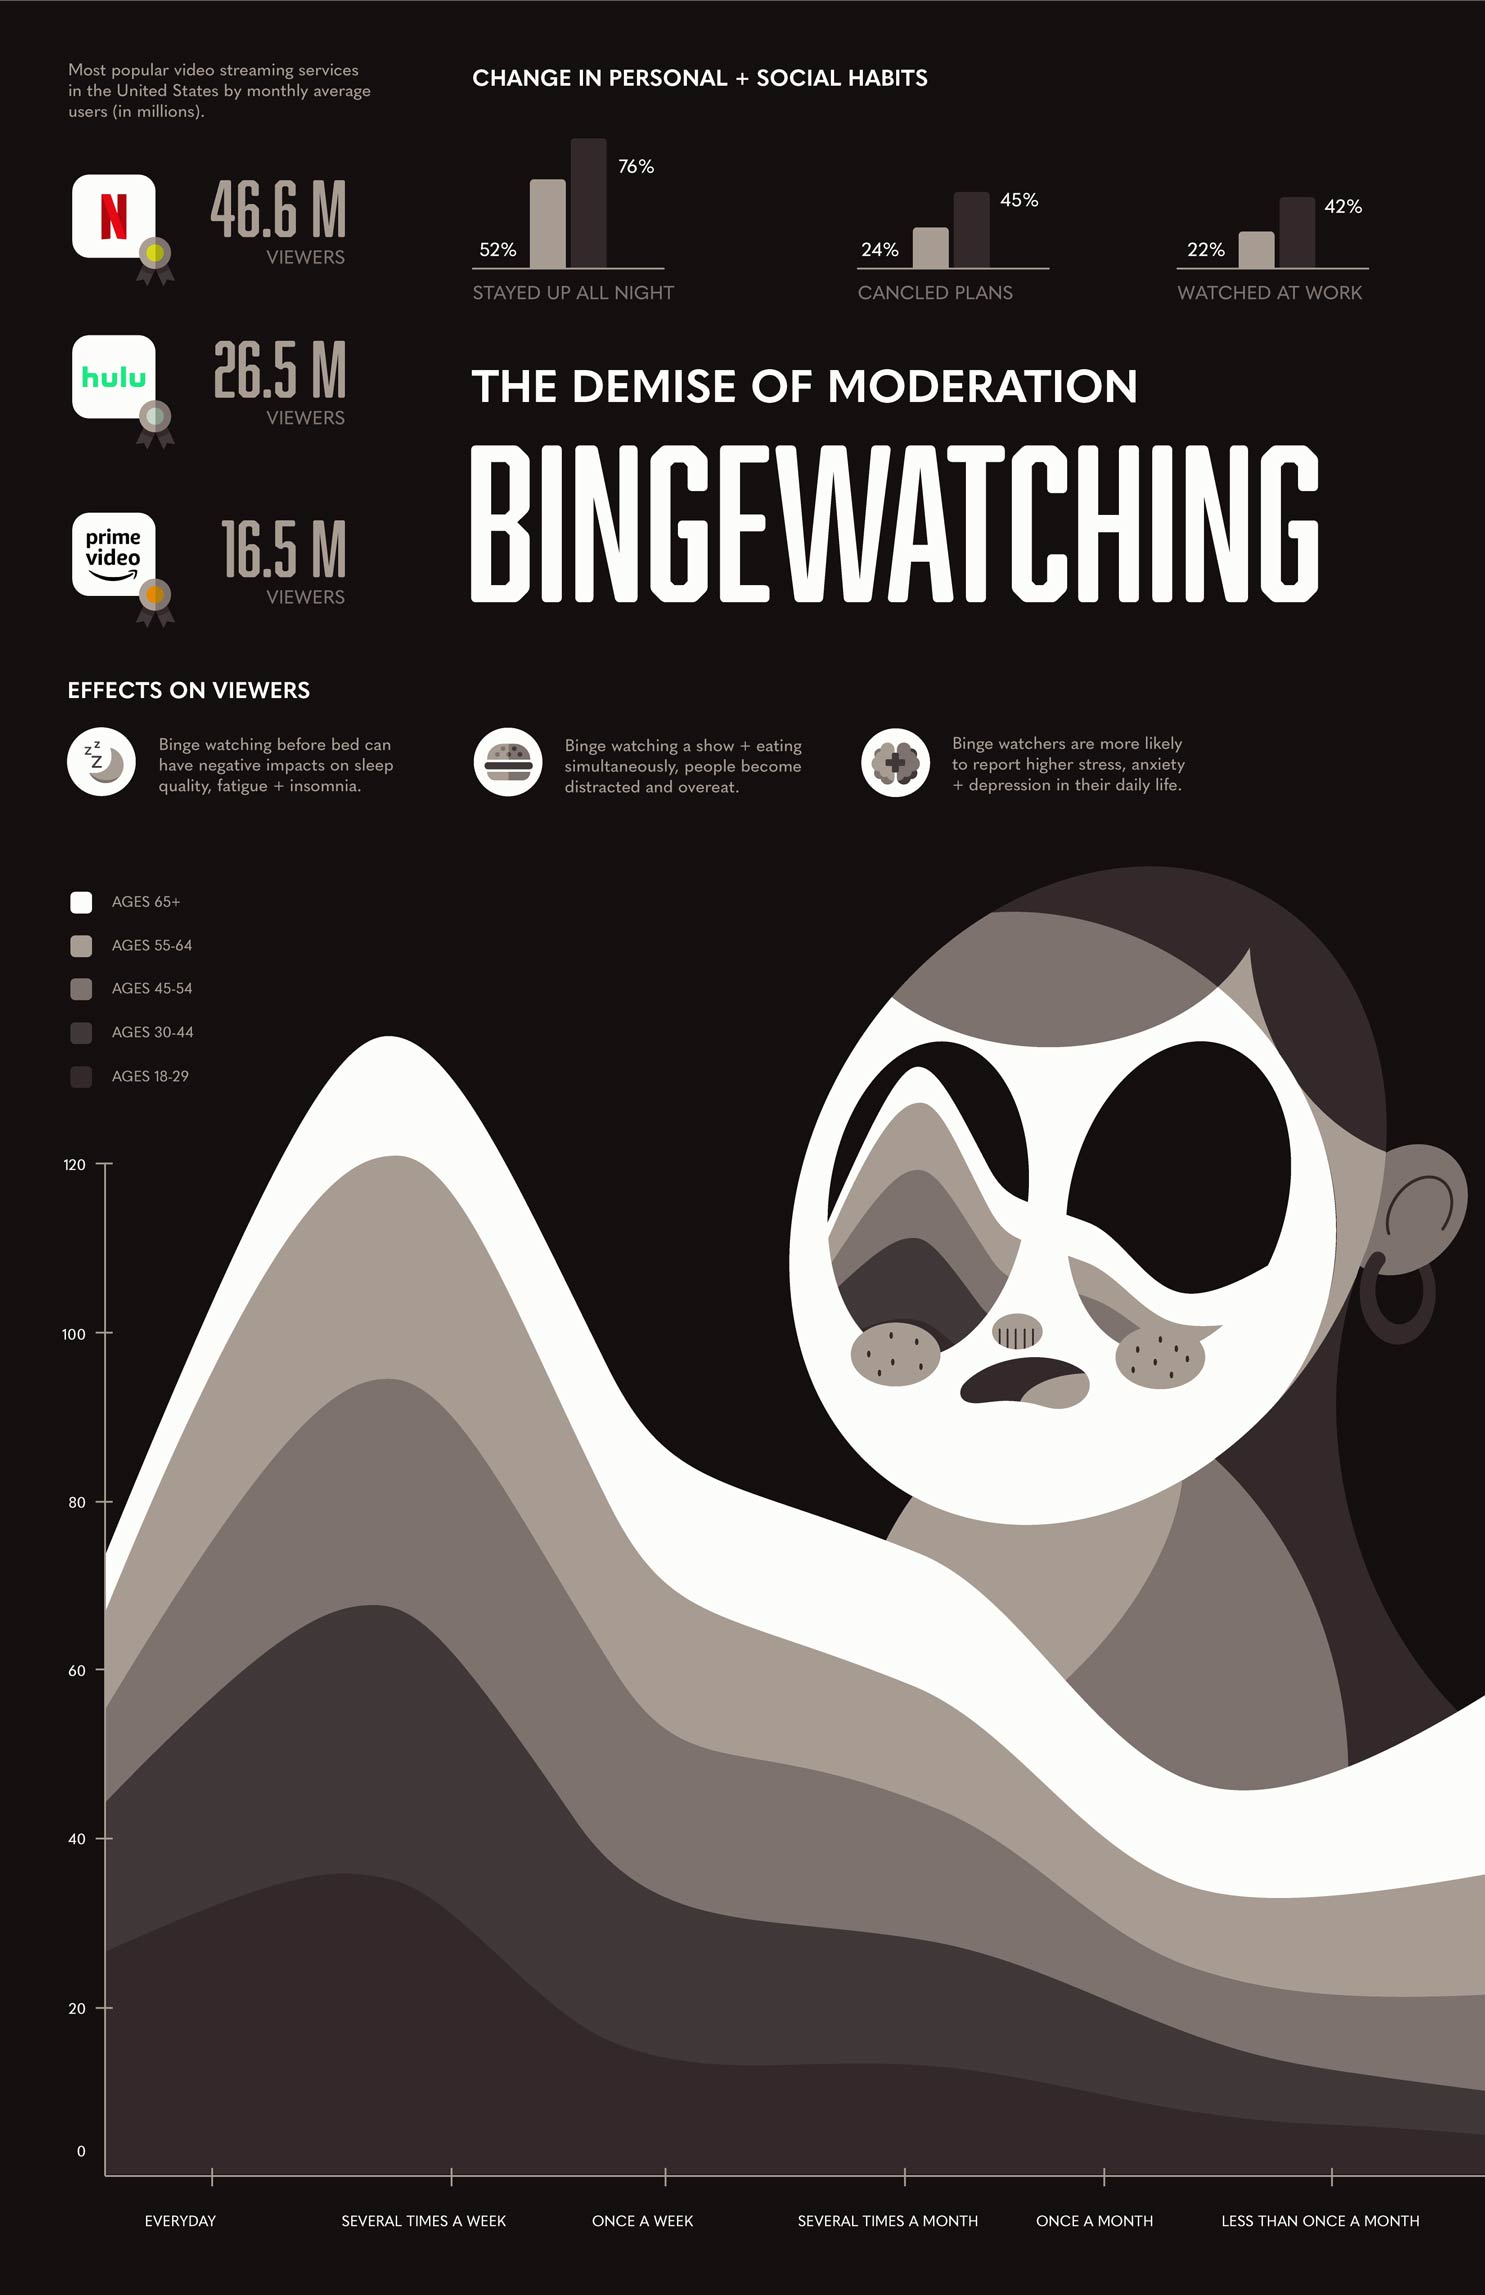
User surveys were conducted in the later stages in order to gain insights into how the infographic was functioning. Tasked based questions were asked to see how effective the layout, design, and content were in communicating information. Refinements were based based on the user’s feedback.